Exporting Metrics to External Monitoring Systems
Overview
Veeam Kasten metrics can be exported to remote monitoring systems using two main methods:
- Prometheus Remote Write - Push metrics directly to remote Prometheus-compatible endpoints (Grafana, Datadog, Thanos, etc.). Recommended for most use cases.
- External Prometheus Integration - Configure an external Prometheus instance to scrape K10's built-in Prometheus server.
This page also covers how to set up an external Grafana instance to visualize K10 metrics with custom dashboards and alerts.
Choose the export method that best fits your monitoring infrastructure.
Prometheus Remote Write
Veeam Kasten's built-in Prometheus instance can be configured to push metrics to remote Prometheus-compatible endpoints using the remote_write feature. This enables integration with external monitoring platforms such as Grafana, Datadog, or other Prometheus-compatible storage systems.
Prerequisites
- Remote Prometheus-compatible endpoint (Grafana, Datadog, etc.)
- Remote write URL and authentication credentials from your monitoring service
kubectlandhelmCLI tools configured
Configuration Options
From your preferred data visualization/aggregation service, obtain a remote_write URL which will be the destination for your Prometheus metrics. You will also need authentication credentials (username/password or bearer token).
Option 1: File-Based Basic Authentication
For enhanced security, store credentials in a Kubernetes Secret and reference them using username_file and password_file.
Step 1: Create a Kubernetes Secret with your username and password:
kubectl create secret generic prometheus-remote-write-basic-auth \
  --from-literal=username=<your-username> \
  --from-literal=password=<your-password> \
  --namespace kasten-io
Step 2: Create k10-remote-write-values.yaml with extraSecretMounts:
clusterName: ""  # REQUIRED: Enter a cluster name
prometheus:
  server:
    remote_write:
      - url: <insert remote backend url>
        basic_auth:
          username_file: /etc/prometheus-secrets/username
          password_file: /etc/prometheus-secrets/password
    extraSecretMounts:
      - name: remote-write-basic-auth
        mountPath: /etc/prometheus-secrets
        secretName: prometheus-remote-write-basic-auth
        readOnly: true
Option 2: Bearer Token File Authentication
For enhanced security, store credentials in a Kubernetes Secret and reference them using bearer_token_file.
Step 1: Create a Kubernetes Secret with your bearer token:
kubectl create secret generic prometheus-remote-write-token \
  --from-literal=token=<your-bearer-token> \
  --namespace kasten-io
Step 2: Create k10-remote-write-values.yaml with extraSecretMounts:
clusterName: ""  # REQUIRED: Enter a cluster name
prometheus:
  server:
    remote_write:
      - url: <insert remote backend url>
        bearer_token_file: /etc/prometheus-secrets/token
    extraSecretMounts:
      - name: remote-write-token
        mountPath: /etc/prometheus-secrets
        secretName: prometheus-remote-write-token
        readOnly: true
Option 3: Basic Authentication with Inline Credentials
This option stores credentials in plain text within Helm values. For production environments, use file-based authentication or bearer token authentication instead (see above).
Create a values file named k10-remote-write-values.yaml (or something similar):
clusterName: ""  # REQUIRED: Enter a cluster name
prometheus:
  server:
    remote_write:
      - url: <insert remote backend url>
        basic_auth:
          username: <insert username>  # Remote backend ID
          password: <insert API key>   # Remote backend API key
clusterName is required when remote_write is enabled; deployment will fail without it. The clusterName will appear as the cluster_name label on all exported metrics. A unique cluster_uid label is automatically added.
Optional Configurations
Basic Metric Filtering
Optionally add basic filtering to drop debug metrics:
prometheus:
  server:
    remote_write:
      - url: <insert remote backend url>
        # ... auth configuration ...
    metricDrop:
      - k10_debug_.*
For more advanced filtering, use write_relabel_configs:
prometheus:
  server:
    remote_write:
      - url: <insert remote backend url>
        # ... auth configuration ...
        write_relabel_configs:
          - source_labels: [__name__]
            regex: '(catalog_actions_count|jobs_.+|action_.+_count|compliance_count)'
            action: keep
Manual Cluster UID Override
If you're using GitOps, helm template, or have RBAC restrictions that prevent namespace lookups, you can manually specify the cluster UID:
clusterName: ""
prometheus:
  server:
    clusterUIDOverride: ""  # Optional: manual cluster UID
    remote_write:
      - url: <insert remote backend url>
        basic_auth:
          username: <insert username>
          password: <insert API key>
For more information on remote_write configuration options, see the Prometheus remote_write documentation.
Apply Configurations
If Veeam Kasten is Already Installed
Apply the new remote_write configuration:
helm upgrade k10 kasten/k10 \
  --namespace kasten-io \
  --values k10-remote-write-values.yaml
If Installing Veeam Kasten for the First Time
helm repo add kasten https://charts.kasten.io/
helm repo update

# Replace "8.0.12" with your desired Veeam Kasten version
helm install k10 kasten/k10 \
  --namespace kasten-io \
  --create-namespace \
  --values k10-remote-write-values.yaml \
  --set global.image.tag="8.0.12"
Confirm metrics in remote backend:
Check your remote monitoring system. Metrics may take 1-2 minutes to appear initially.
For additional details on configuring remote_write with Veeam Kasten, refer to Kasten Prometheus Export via remote_write.
Integrating External Prometheus with Veeam Kasten
For most use cases, Prometheus Remote Write provides a simpler alternative that pushes metrics directly to remote endpoints. Use this method if you need an external Prometheus instance to actively scrape K10's metrics.
An external Prometheus instance can be configured to scrape metrics from Veeam Kasten's built-in Prometheus server. This is useful when you have a centralized Prometheus deployment that needs to collect metrics from multiple sources.
To integrate external Prometheus with Veeam Kasten, set the flags global.prometheus.external.host and global.prometheus.external.port. If external Prometheus is setup with a base URL, set the global.prometheus.external.baseURL flag. Make sure RBAC was enabled while setting up external Prometheus to enable target discovery.
The following scrape config is an example of how a Prometheus server hosted in the same cluster might be configured:
- job_name: k10
  scrape_interval: 15s
  honor_labels: true
  scheme: http
  metrics_path: '/<k10-release-name>/prometheus/federate'
  params:
    'match[]':
      - '{__name__=~"jobs.*"}'
  static_configs:
    - targets:
      - 'prometheus-server.kasten-io.svc.cluster.local'
      labels:
        app: "k10"
An additional NetworkPolicy may need to be applied in certain environments.
Although it's possible to disable Veeam Kasten's built-in Prometheus server, it is recommended to leave it enabled. Disabling the server reduces functionality in various parts of the system such as usage data, reporting, and the multi-cluster dashboard. To disable the built-in server, set the prometheus.server.enabled value to false.
If the built-in server has previously been disabled, it can be re-enabled during a helm upgrade (see Upgrading Veeam Kasten) with: --set prometheus.server.enabled=true.
Scrape Config
Update the Prometheus scrape configuration by adding two additional targets:
- job_name: httpServiceDiscovery
  http_sd_configs:
    - url: http://metering-svc.kasten-io.svc.cluster.local:8000/v0/listScrapeTargets
- job_name: k10-pods
  scheme: http
  metrics_path: /metrics
  kubernetes_sd_configs:
    - role: pod
      namespaces:
        own_namespace: true
      selectors:
        - role: pod
          label: "component=executor"
  relabel_configs:
    - action: labelmap
      regex: __meta_kubernetes_pod_label_(.+)
    - source_labels: ___meta_kubernetes_pod_container_port_number_
      action: keep
      regex: 8\d{3}
It is possible to obtain those targets from Veeam Kasten's Prometheus' configuration, if Prometheus was installed with Veeam Kasten, you should skip job:prometheus. (Note. yq utility is needed to execute commands successfully)
## Get prometheus job
kubectl get cm k10-k10-prometheus-config -n kasten-io -o "jsonpath={.data['prometheus\.yml']}" | yq '.scrape_configs'

## Update prometheus configmap with given output.
The targets will show up after adding the scrape config. Note that the targets will not be scraped until a network policy is added.
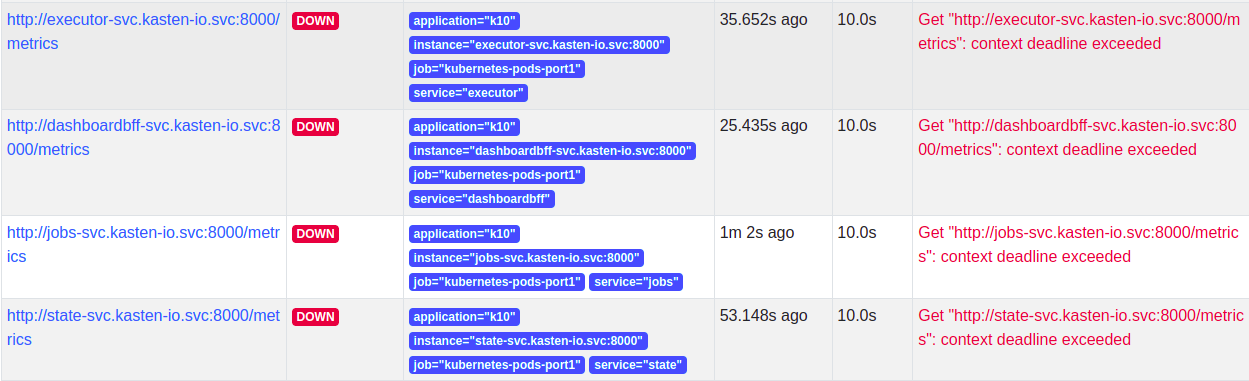
Network Policy
Once the scrape config is in place, the targets will be discovered but Prometheus won't be able to scrape them as Veeam Kasten has strict network policies for inter-service communication. To enable communication between external Prometheus and Veeam Kasten, a new network policy should be added as follows.
Add a label to the namespace where external Prometheus is installed
-kubectl label namespace/prometheus app=prometheus and apply the
following network policy to enable communication.
apiVersion: networking.k8s.io/v1
kind: NetworkPolicy
metadata:
  labels:
    app: k10
    heritage: Helm
    release: k10
  name: allow-external-prometheus
spec:
  ingress:
    - from:
        - namespaceSelector:
            matchLabels:
              app: prometheus
  podSelector:
    matchLabels:
      release: k10
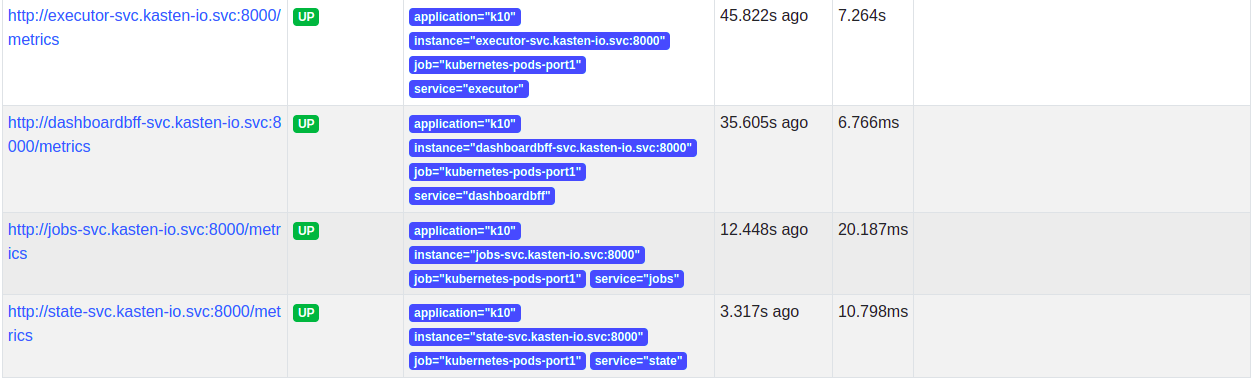
Once the network policy enables communication, all the service targets will start coming up and the metrics will be scraped.
Using Externally Installed Grafana
If you're using Prometheus Remote Write to send metrics to Grafana Cloud or another hosted Grafana service, you don't need to install Grafana on your cluster. Remote Write allows you to export metrics directly to your external monitoring platform where Grafana is already available.
This document can be followed to install a separate instance of Grafana and setup Veeam Kasten Grafana dashboard, alerts into that.
Configuring Grafana's URL
Once a separate instance of Grafana is installed on the Cluster, its URL can be configured, using the Helm field below, while installing Veeam Kasten to make it easier to access Grafana from Veeam Kasten's dashboard.
--set grafana.external.url=<grafana-url>
Accessing Grafana from Veeam Kasten's dashboard
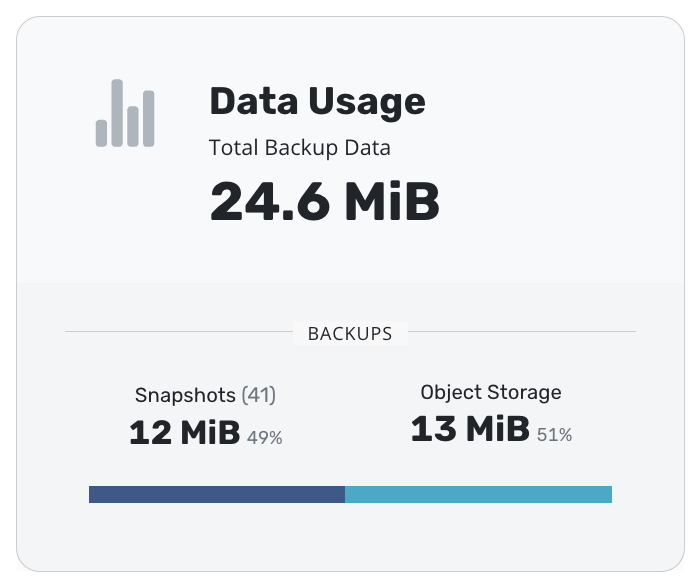
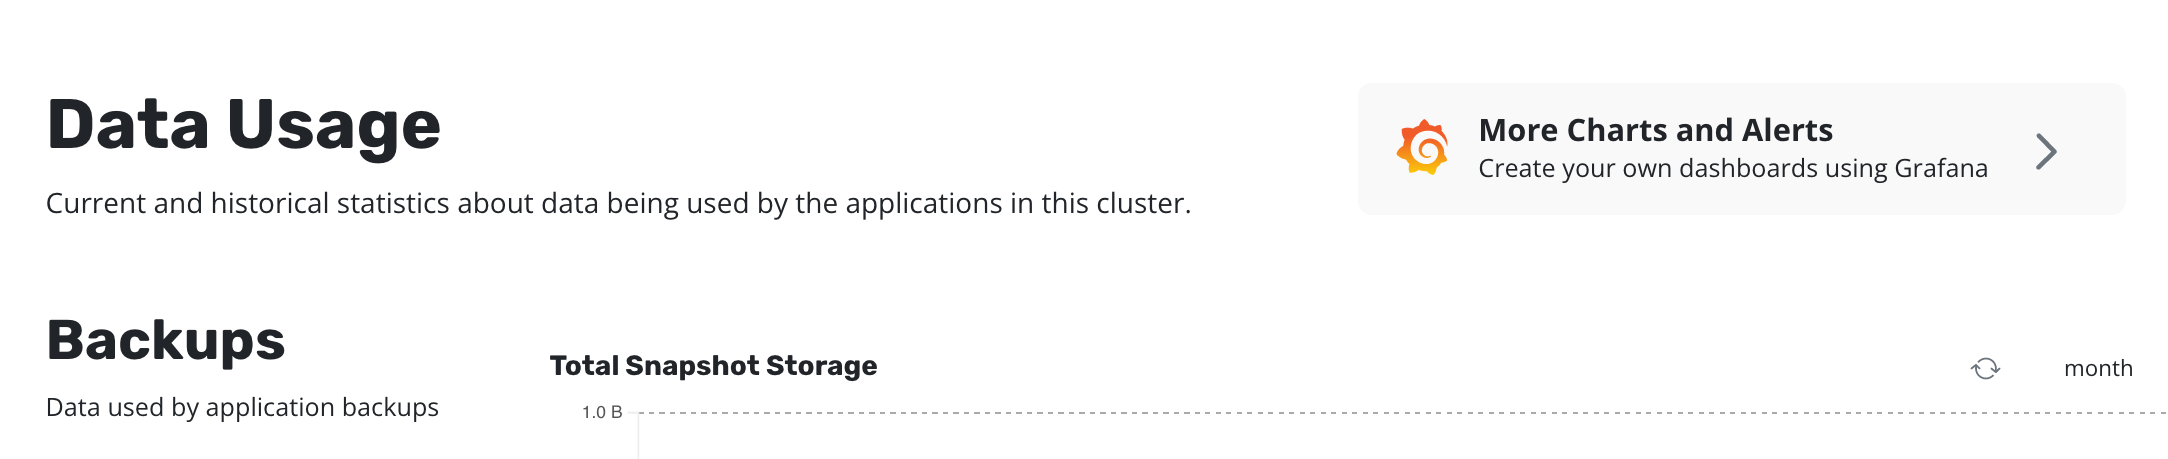
Click on the "Data Usage" card on Veeam Kasten's dashboard.
Click on "More Charts and Alerts" to access the instance of Grafana installed with Veeam Kasten.
Charts and Graphs
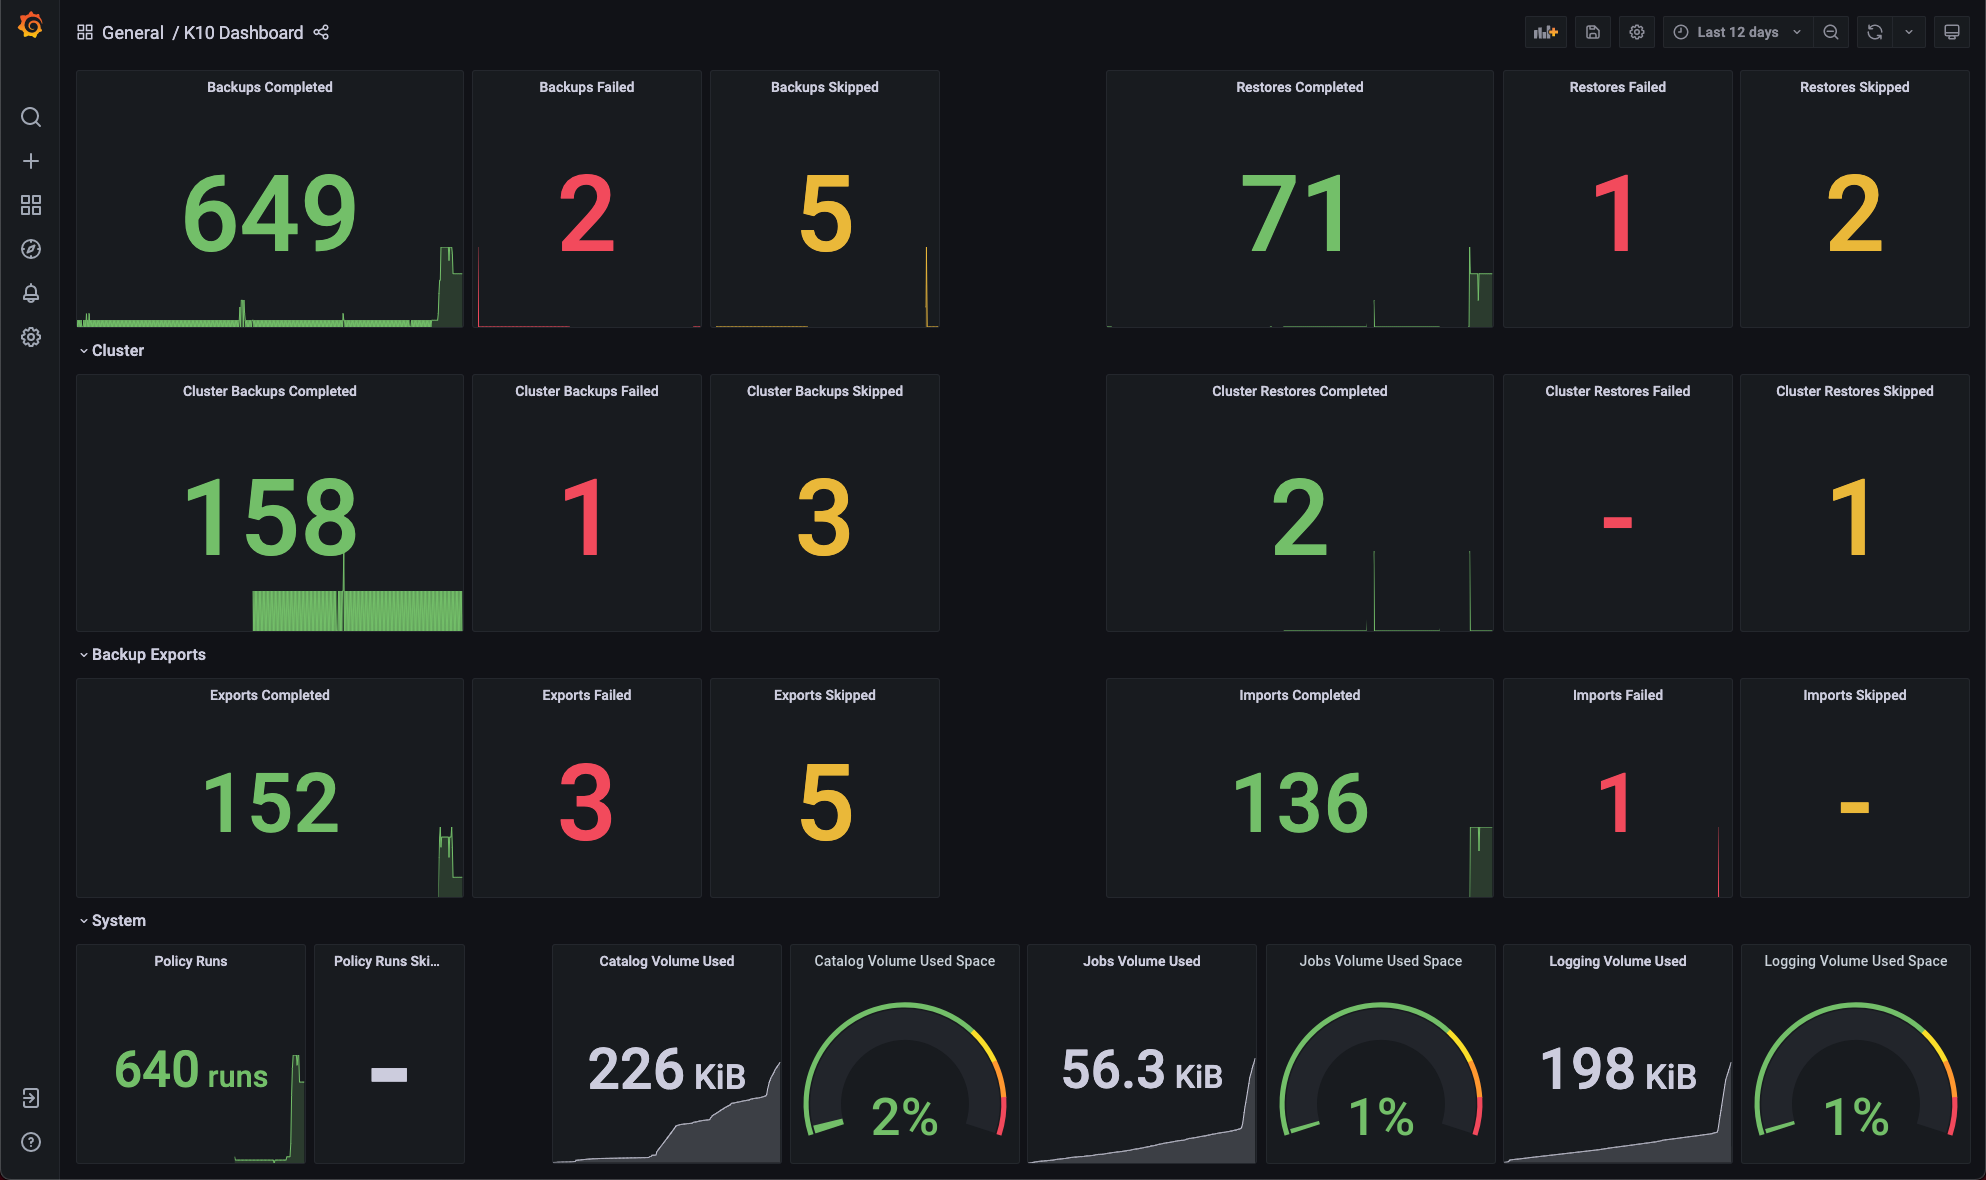
The Grafana dashboard can be used to monitor how many application scoped or cluster scoped actions (backup, restore, export and import) have completed, failed or been skipped.
It shows the number of policy runs that have completed or been skipped.
The amount of disk space consumed and the percentage of free space available in Veeam Kasten's stateful services (catalog, jobs, and logging) are also shown.
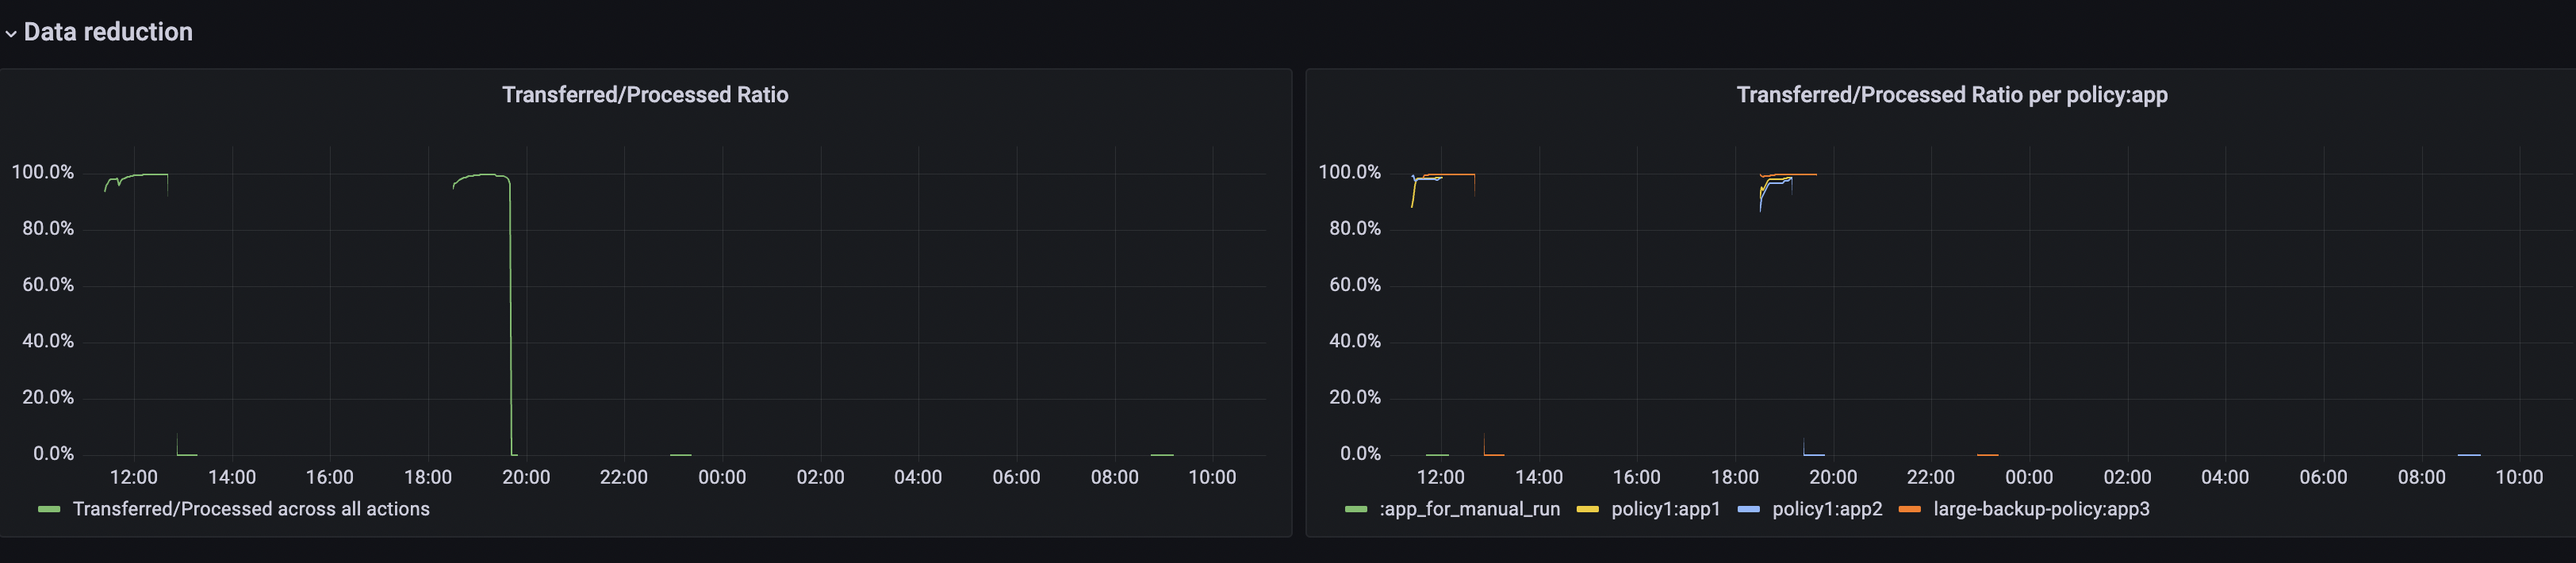
The Data reduction section provides graphs which show the amount of data being transferred (e.g, when the new volume has been exported it will be close to 100%, as all data needs to be transferred, but with an unchanged volume it will be 0% since most of the data has already been exported):
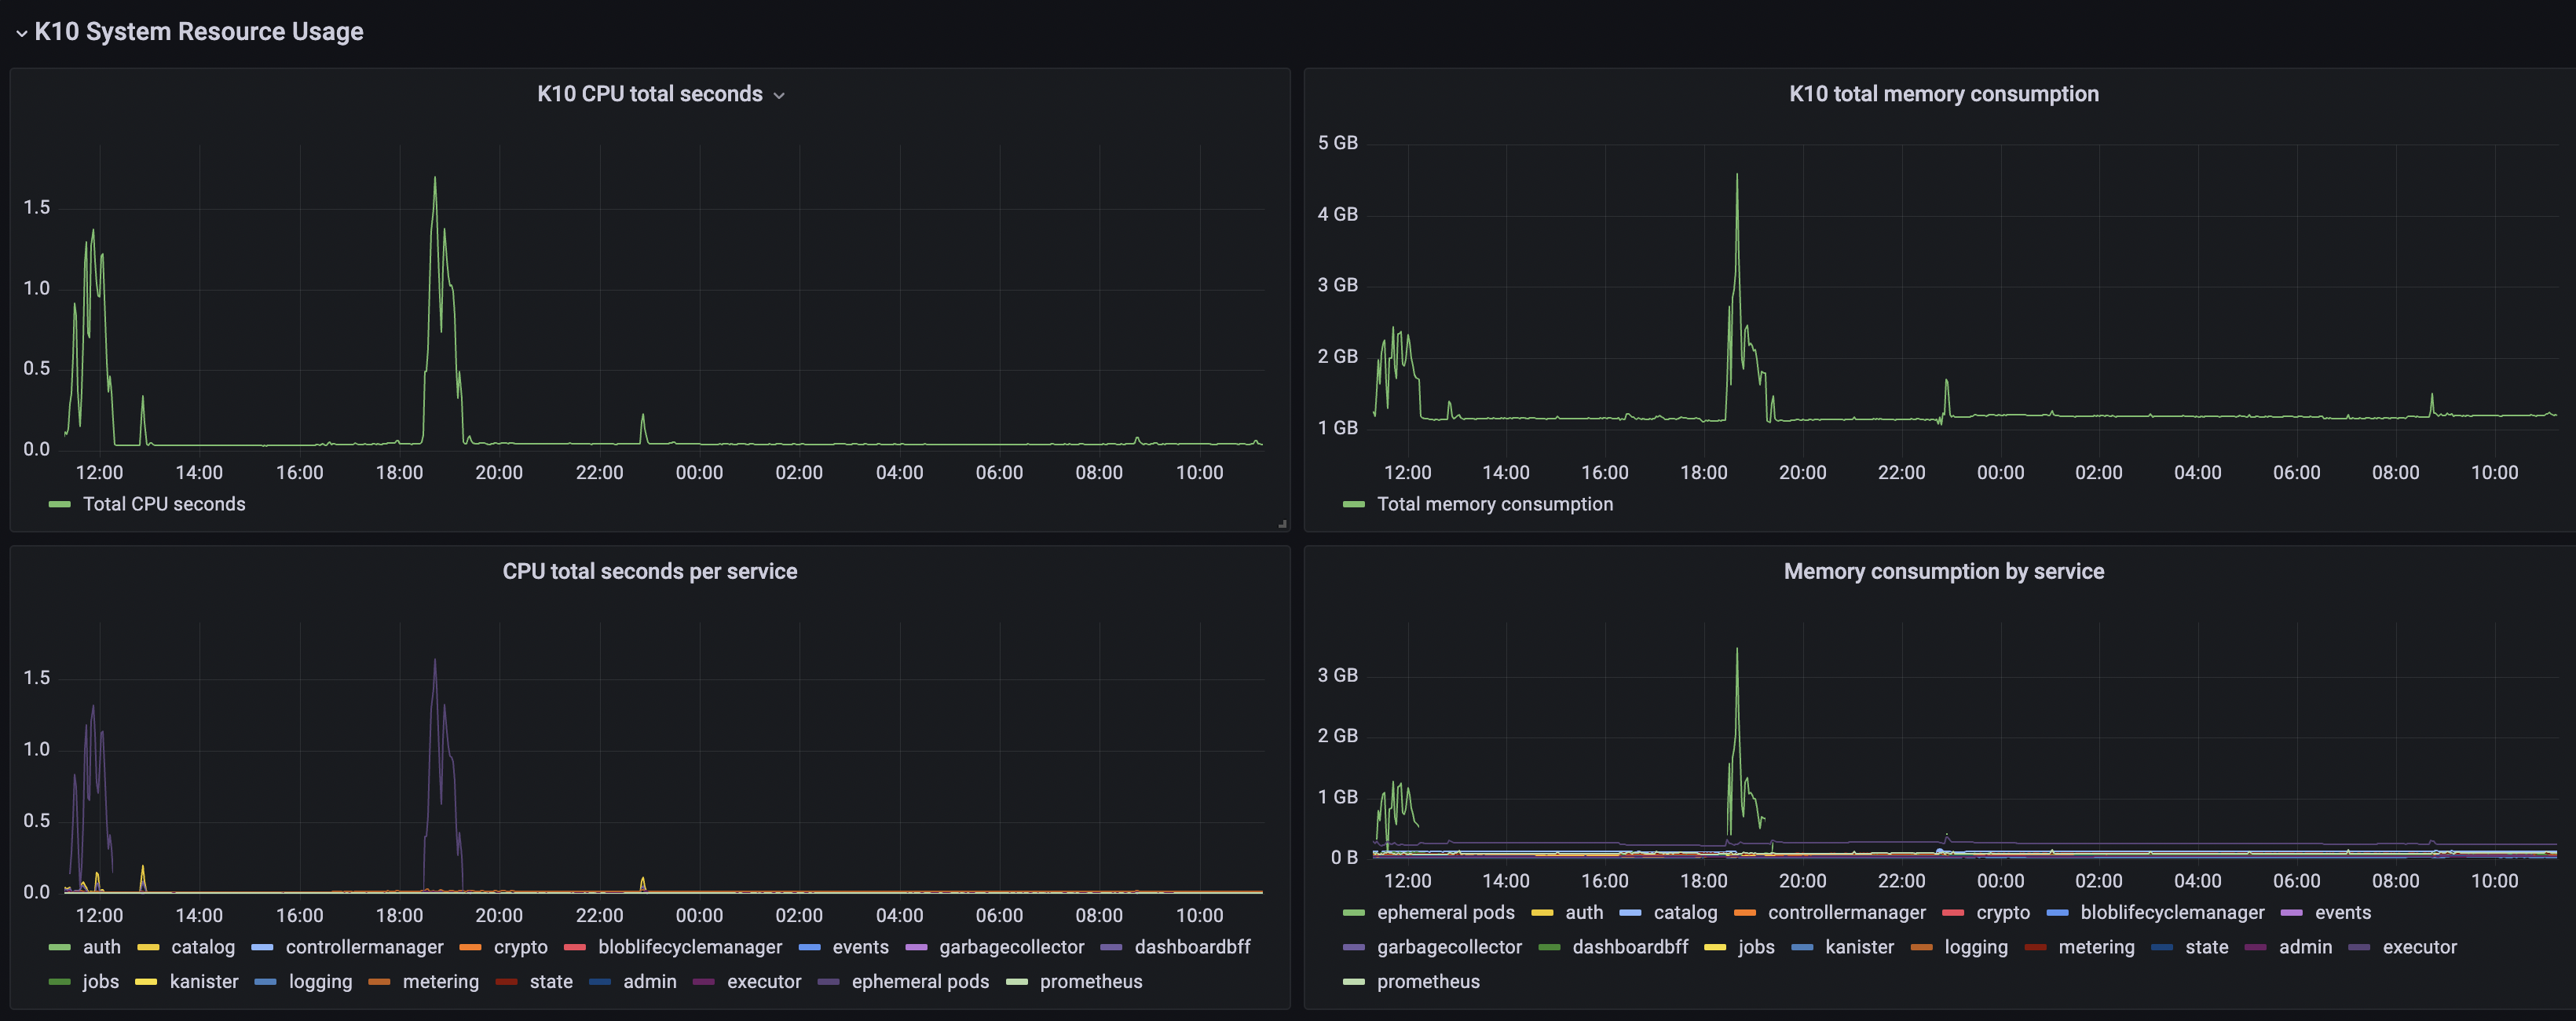
The Veeam Kasten System Resource Usage section provides CPU/Memory usage graphs specific to Veeam Kasten and metrics that describe task execution performance:
The Data transfer operations section provides graphs on the transfer of data to and from storage repositories that are captured by the data transfer metrics described above.
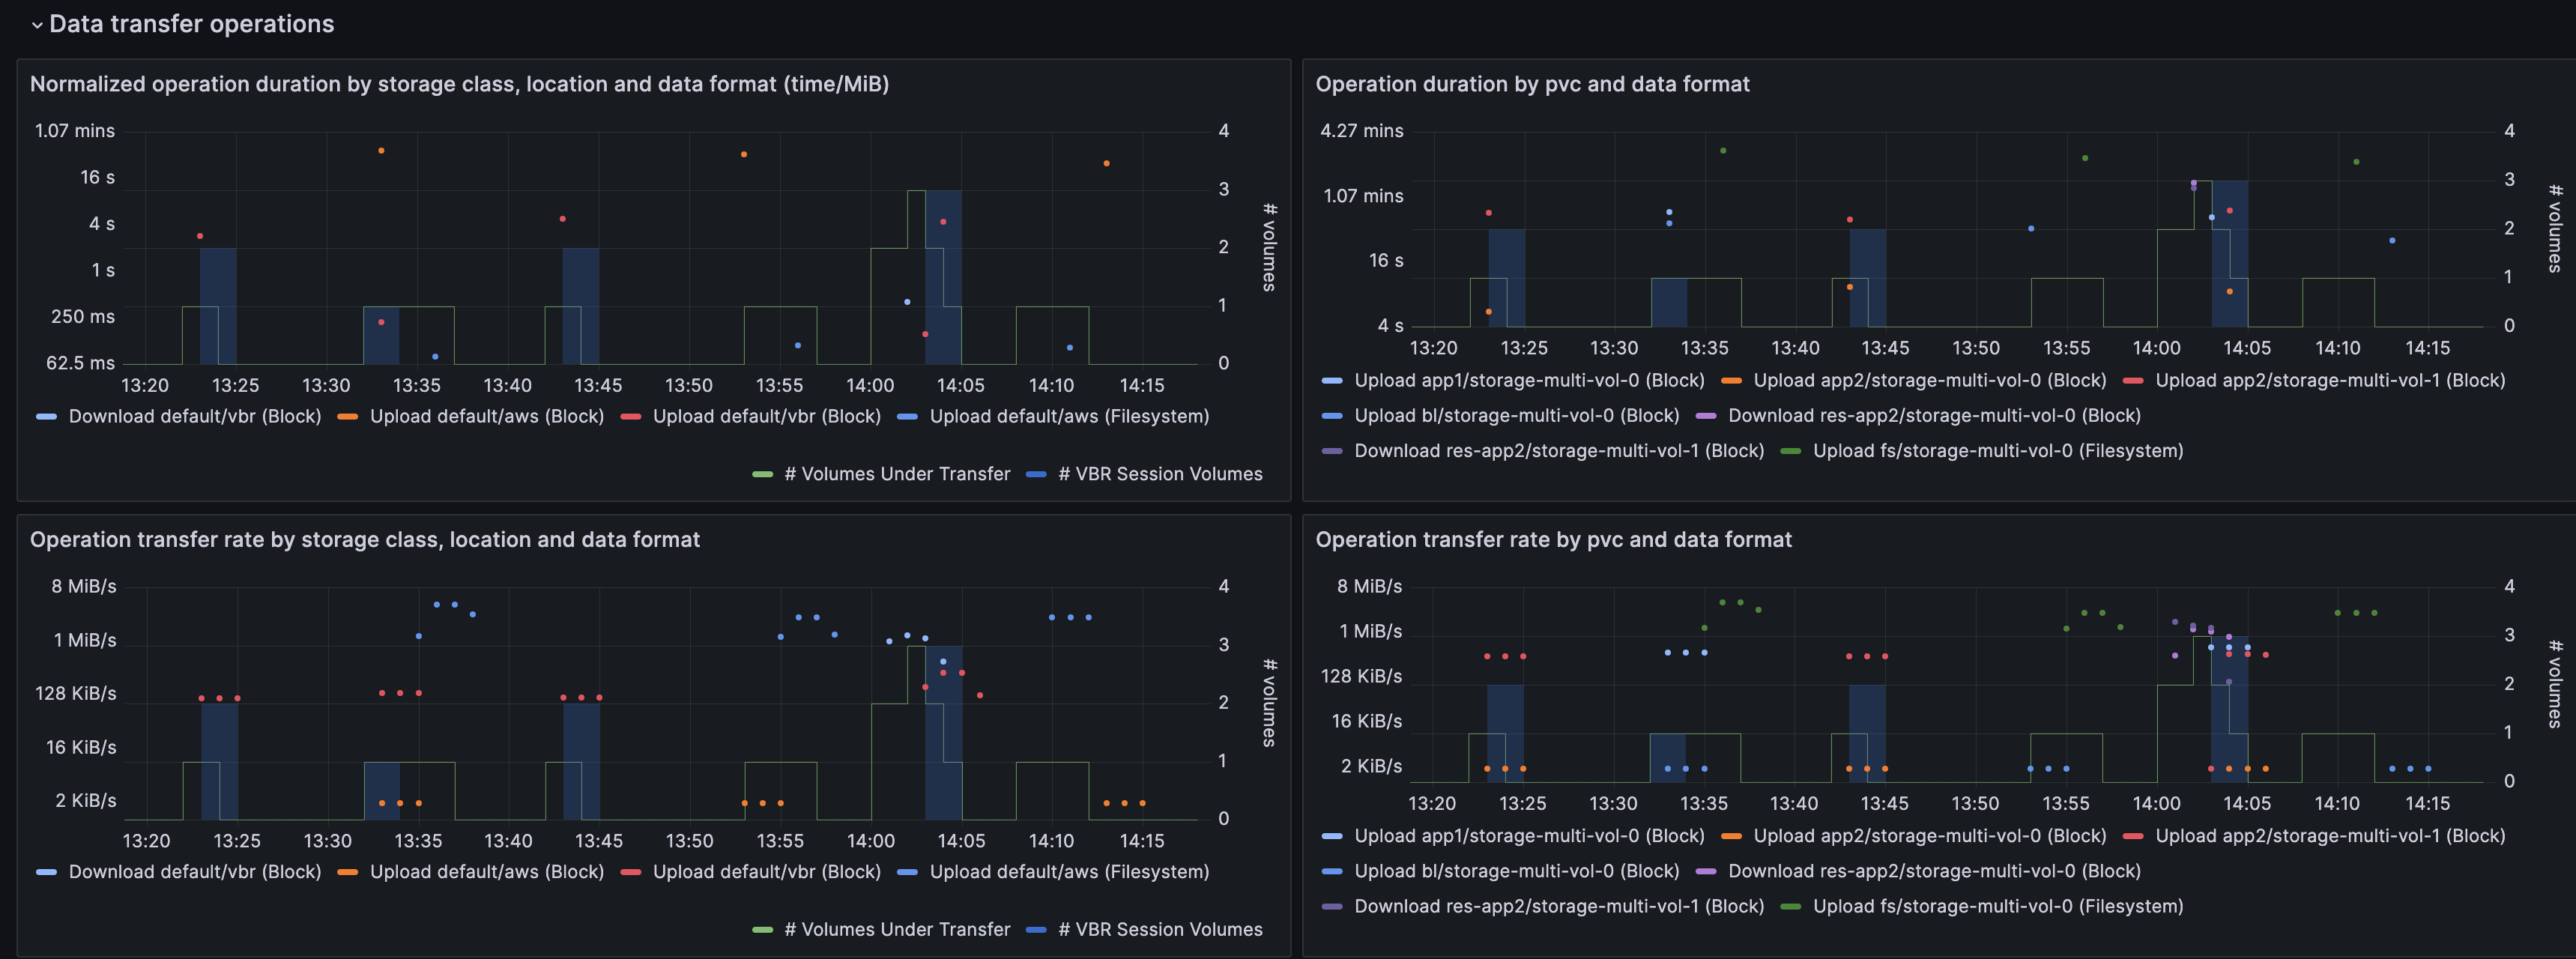
The column on the left is organized by storage class, location profile, and the export mechanism used. The upper panel displays the normalized duration of transfer operations, while the lower panel shows the data transfer rate. (The normalized duration expresses the time taken to transfer one MiB of data, and hence is comparable between the different time series displayed in the panel).
The column on the right is organized by individual PVC and data format used, with the upper panel showing the actual duration of individual operations and the lower panel showing the transfer rate.
All panels have an overlay that displays the number of volume operations in progress. In addition, if VBR is used, the number of volumes involved in VBR upload sessions will be shown in a shaded area.
Grafana Alerts
Grafana can be used to create alerts to get notified moments after something unexpected happens in your system. An alert can be generated by specifying a condition or evaluation criteria and, these conditions can be configured using Alert rules. Each rule uses a query that fetches data from a data source. Each query involves a metric such as the Veeam Kasten metrics described in the monitoring overview. More can be read about this by following the Grafana Alerting documentation.
There are three main constructs that are involved while creating alerts in Grafana:
Alert rules
The condition on which the alerts should be fired can be configured using alert rules.
A new alert rule can be created by going to the dashboard's edit option
and then clicking on the Alert tab at the bottom of the page. In this
example, it's assumed that a dashboard panel named Dashboard Local is
already created.
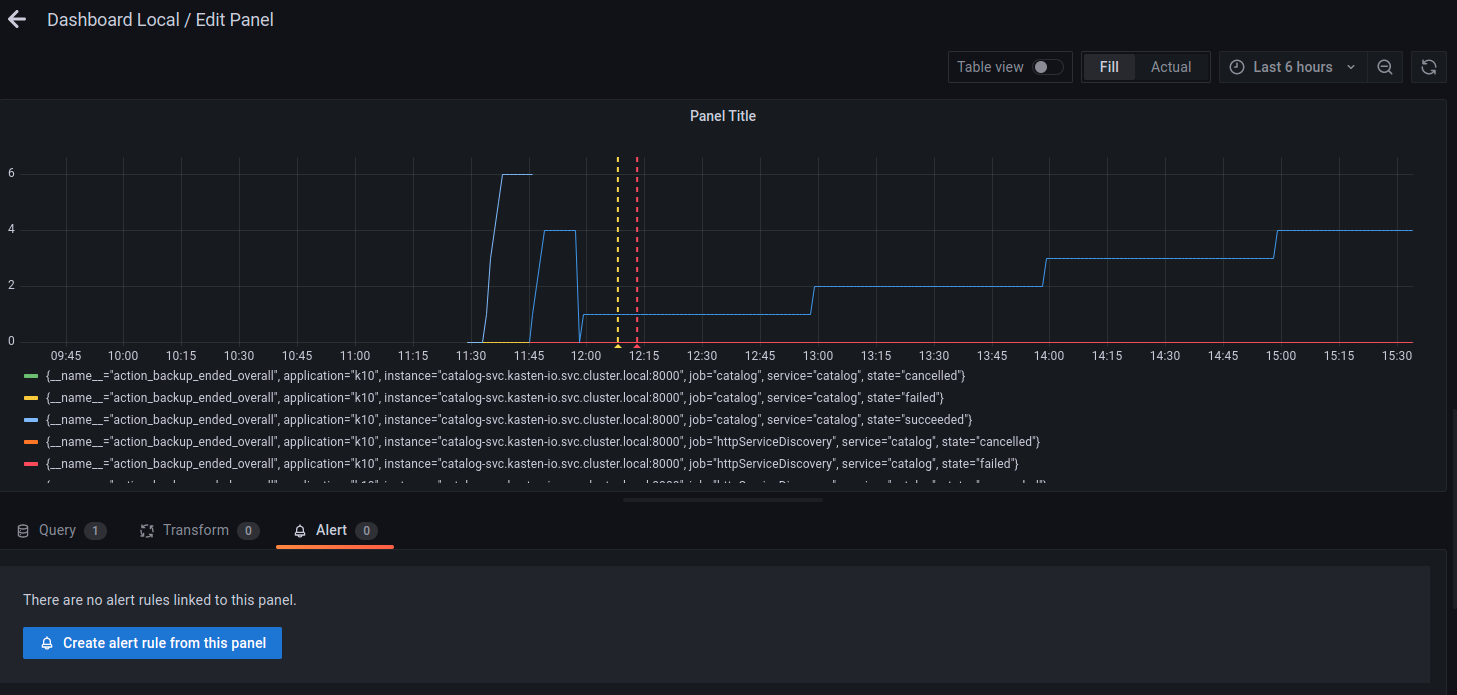
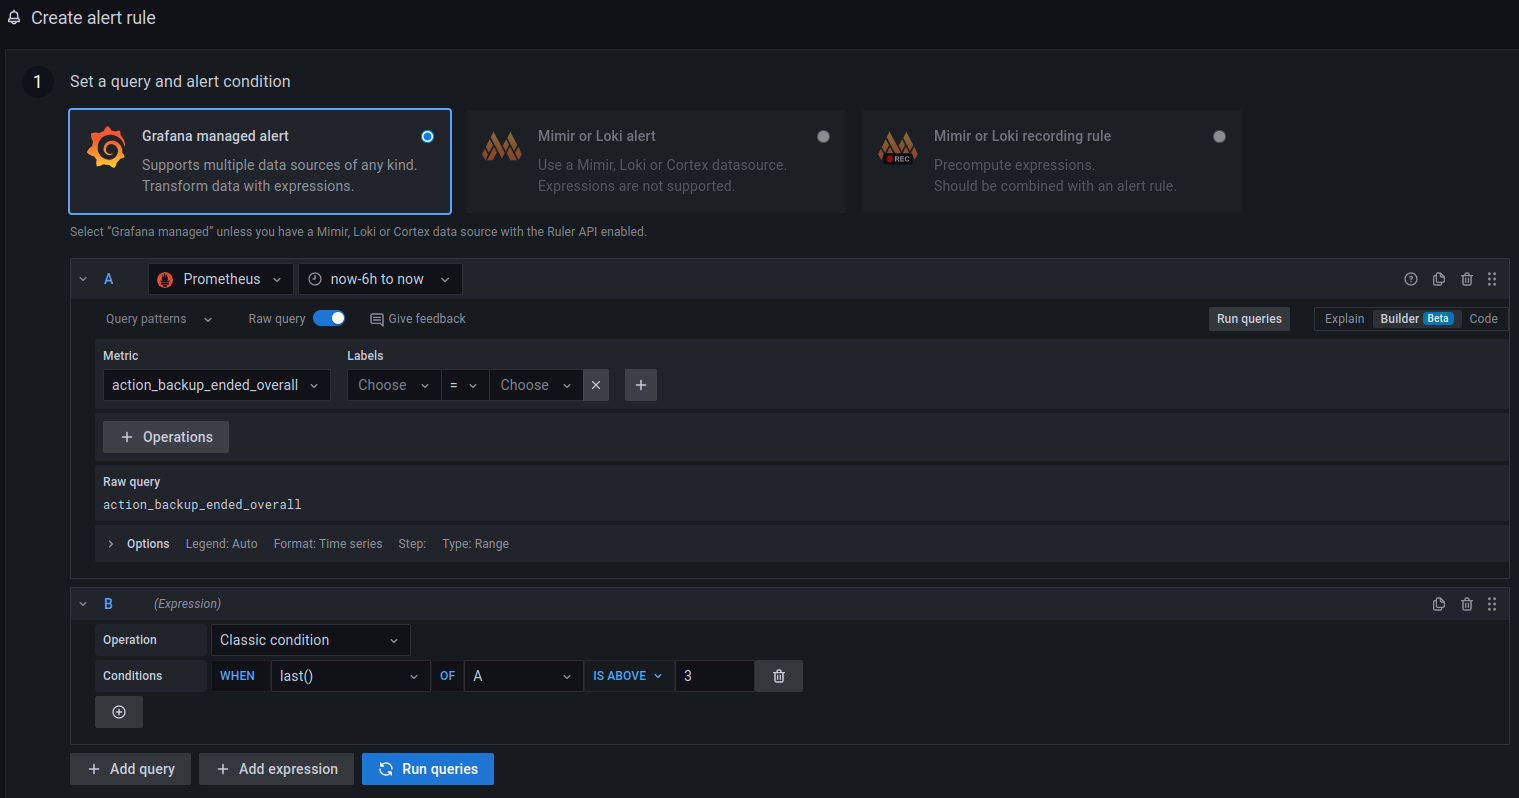
Once there, the Create alert rule from this panel button can be used
to set the query and alert condition for this alert rule. Configure the
datasource that should be used in this alert and the metric that should
be queried.
In this example, datasource Prometheus and metric
action_backup_ended_overall were used.
After setting the query and alert condition, the label of this alert
rule can be configured by scrolling down the same page, until
Notifications options.
Labels are useful to configure where these alerts are going to be sent.
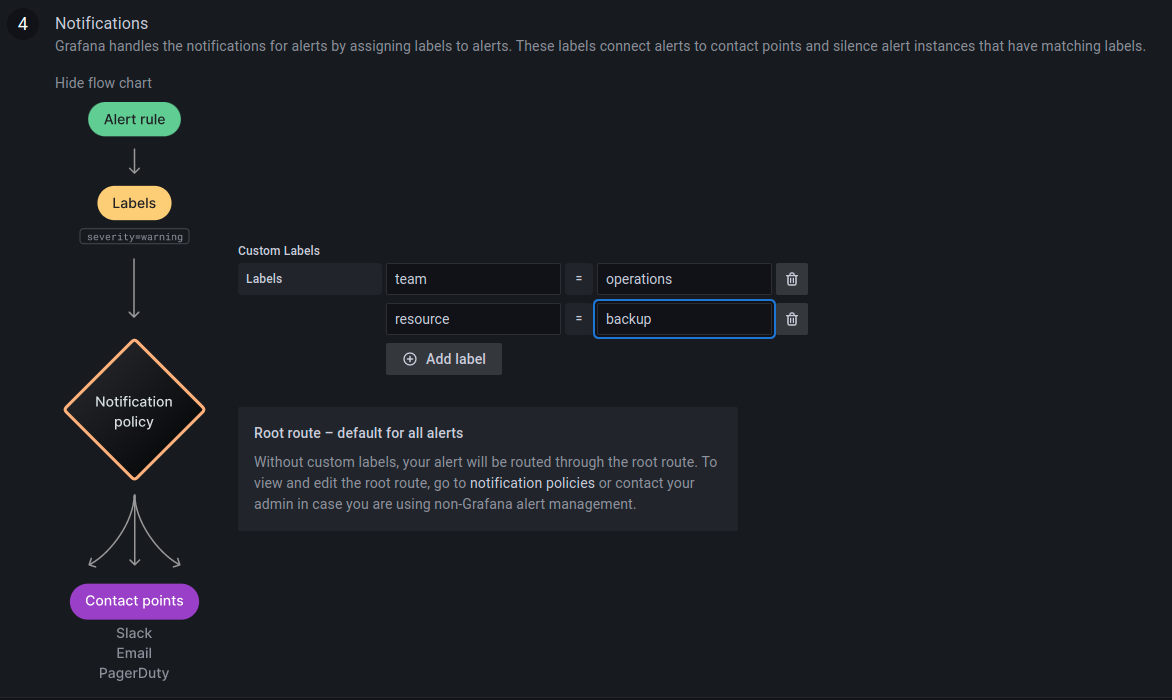
In this example, the labels team:operations and resource:backup have
been used.
Click on Save and Exit to save the dashboard with this alert rule and
exit.
Contact Points
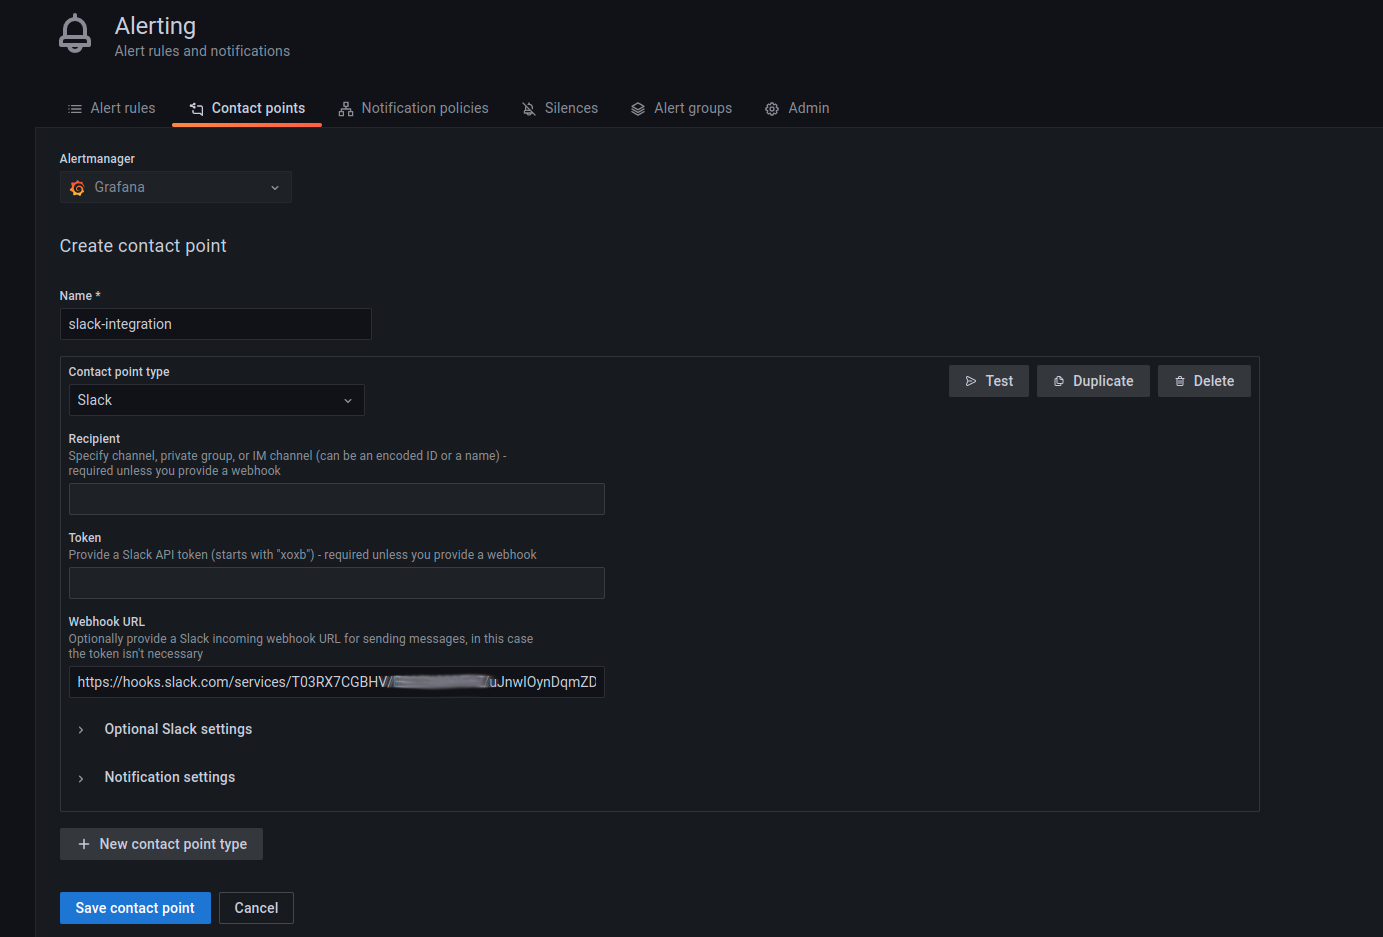
Contact points are used to configure the communication medium for the alerts that are going to be generated. For example, in some scenarios, it might be useful to get a slack message as soon as an alert is fired. In that case, slack must be configured as a contact point. To see a list of all the contact point types, refer to this Grafana documentation.
A contact point can be configured by going to the Alerting dashboard and
then clicking on New contact point under the Contact points tab. In
the example below, slack has been chosen as the contact point type.
Notification Policies
Once the alerts rule and contact points have been configured, the relationship between these two configurations is established by creating a Notification policy.
A notification policy can be configured by going to the Alerting
dashboard and then clicking on New specific policy under the
Notification policies tab.
The example below uses the same labels specified while creating the alert rule in the previous step.
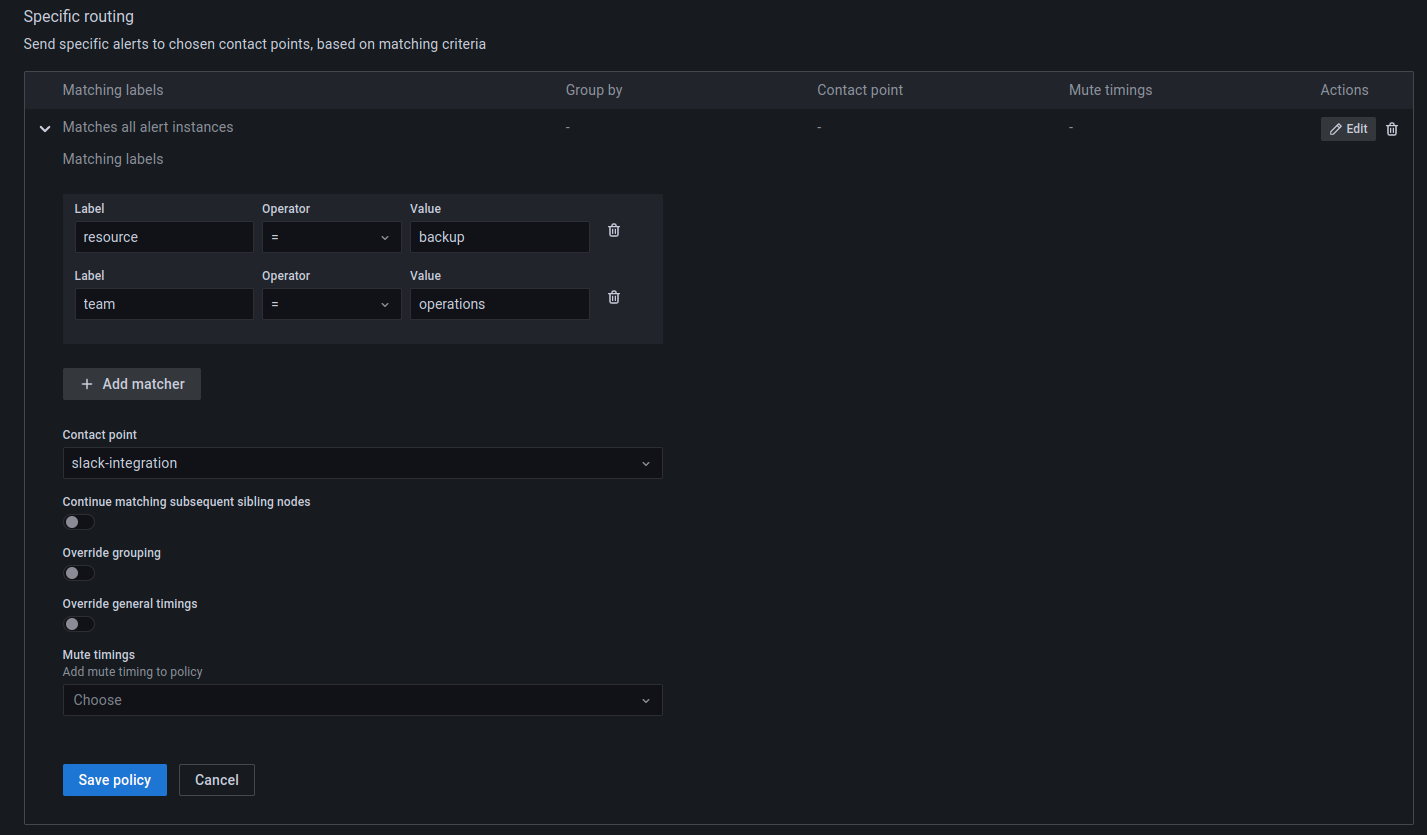
When an alert is generated based on the rule configured, notifications will be sent to the slack channel.