Monitoring
Veeam Kasten enables centralized monitoring of all its activity by integrating with Prometheus. In particular, it exposes a Prometheus endpoint from which a central system can extract data. This section documents how to use the built-in Prometheus instance, and describes the metrics currently exposed by Veeam Kasten.
Metrics can also be exported to external or on-cluster monitoring platforms for unified visibility across multiple clusters:
- General (Grafana, Datadog, Thanos, etc.): See Exporting Metrics to External Monitoring Systems.
- Red Hat OpenShift: See Red Hat ACM Observability.
Using Veeam Kasten's Prometheus Endpoint
By default, Prometheus is configured with persistent storage size 8Gi
and retention period of 30d. That can be changed with
--set prometheus.server.persistentVolume.size=<size> and
--set prometheus.server.retention=<days>.
Prometheus requires Kubernetes API access to discover Veeam Kasten pods
to scrape their metrics. Thus, by default Role and RoleBinding
entries are created in Veeam Kasten namespace. However, if you set
prometheus.rbac.create=true, global ClusterRole and
ClusterRoleBinding will be created instead.
The complete list of configurable parameters can be found at Advanced Install Options.
If for some reason you don't want helm to create RBAC for you
automatically and you have both rbac.create=false and
prometheus.rbac.create=false, you can create Role and RoleBinding
manually:
kind: Role
apiVersion: rbac.authorization.k8s.io/v1
metadata:
  name: k10-prometheus-server
  namespace: kasten-io
rules:
- apiGroups:
  - ""
  resources:
  - nodes
  - nodes/proxy
  - nodes/metrics
  - services
  - endpoints
  - pods
  - ingresses
  - configmaps
  verbs:
  - get
  - list
  - watch
- apiGroups:
  - extensions
  - networking.k8s.io
  resources:
  - ingresses/status
  - ingresses
  verbs:
  - get
  - list
  - watch
---
kind: RoleBinding
apiVersion: rbac.authorization.k8s.io/v1
metadata:
  name: k10-prometheus-server
  namespace: kasten-io
roleRef:
  apiGroup: rbac.authorization.k8s.io
  kind: Role
  name:  k10-prometheus-server
subjects:
  - kind: ServiceAccount
    name: prometheus-server
    namespace: kasten-io
Veeam Kasten Metrics
When using Veeam Kasten Multi-Cluster Manager (i.e., a
cluster setup as a primary), to query metrics for the primary cluster
from its Prometheus instance a cluster label with a blank value ("")
is required.
Veeam Kasten Action Metrics
When Veeam Kasten performs various actions throughout the system, it collects metrics associated with these actions. It records counts for both cluster and application-specific actions.
These action metrics include labels that describe the context of the
action. For actions specific to an application, the application name is
included as app. For actions initiated by a policy, the policy name is
included as policy. For ended actions, the final status is included as
state.
Action States
Veeam Kasten actions progress through various states during their lifecycle. The following table describes each state and its corresponding metric label value:
| Action State | Metric Label | Description |
|---|---|---|
| Pending | pending |
Action has been created but not yet started |
| Running | running |
Action has been validated and is currently executing |
| AttemptFailed | attempt_failed |
At least one action phase needs to retry |
| Failed | failed |
Action has failed (at least one phase failed permanently) |
| Complete | succeeded |
Action has completed successfully or with exceptions |
| Cancelled | cancelled |
Action was cancelled before completion |
| Skipped | skipped |
Action has been skipped |
| Deleting | deleting |
Action is being deleted |
Separate metrics are collected for the number of times the action was
started, ended, or skipped. This is indicated by the suffix of the
metric (i.e., _started_count, _ended_count, or _skipped_count).
An overall set of metrics is also collected that does not include the
app or policy labels. These metrics end with _overall rather than
_count. It is recommended to use the overall metrics unless specific
application or policy information is required.
Metrics are collected for the following actions:
backupandbackup_clusterrestoreandrestore_clusterexportimportreportrun
For example, to query the number of successful backups in the past 24 hours:
sum(round(increase(action_ended_total{action="backup",state="succeeded"}[24h])))
Or, to query the number of failed restores for the past hour:
sum(round(increase(action_ended_total{action="restore",state="failed"}[1h])))
When querying metrics that are reported as counters, such as action
metrics, the increase or rate functions must be used. See
Prometheus query
functions
for more information.
Examples of Action Metrics
action_export_processed_bytes The overall bytes processed during the
export. Labels: policy, app, app_namespace
action_export_transferred_bytes The
overall bytes transferred during the export. Labels: policy, app, app_namespace
See the Prometheus docs for more information on how to query data from Prometheus.
Veeam Kasten Artifact Metrics
You can monitor both the rate of artifact creation and the current count within Veeam Kasten. Similar to the action counts mentioned above, there are also the following metrics, which track the number of artifacts backed up by Veeam Kasten within a defined time frame:
action_artifact_countaction_artifact_count_by_appaction_artifact_count_by_policy
To see the number of artifacts protected by snapshots currently you can use the following metrics.
artifact_sumartifact_sum_by_appartifact_sum_by_policy
If an artifact is protected by multiple snapshots then it will be counted multiple times.
Veeam Kasten Compliance Metrics
To track the number of applications that fall outside of compliance, you
can use the compliance_count metric, which includes the following
states of interest: [NotCompliant, Unmanaged]. If the cluster contains
pre-existing namespaces, which are not subject to compliance concerns,
you have the option to use the Helm flag excludedApps to exclude them.
This action will remove both the application(s) from the dashboard and
exclude them from the compliance_count. You can set this exclusion
using the inline array (excludedApps: ["app1", "app2"]) or the
multi-line array, specifying the applications to be excluded:
excludedApps:
  - app1
  - app2
If you prefer to set Helm values inline rather than through a YAML file, you can do this with the following:
--set excludedApps[0]="app1"
--set excludedApps[1]="app2"
See the knowledge base article for more information.
Veeam Kasten Execution Metrics
Aggregating Job and Phase Runner Metrics
Designed especially for measuring the parallelism usage:
| Name | Type | Description | Labels |
|---|---|---|---|
exec_active_job_count |
gauge |
Number of active jobs at a time | * action - Action name (e.g. manualSnapshot, retire) |
exec_started_job_count_total |
counter |
Total number of started jobs per executor instance | * action - Action name (e.g. manualSnapshot, retire) |
exec_active_phase_count |
gauge |
Number of active phases for a given action and with a given name per executor instance | * action - Action name (e.g. manualSnapshot, retire)* phase - Phase name (e.g. copySnapshots, reportMetrics) |
exec_started_phase_count_total |
counter |
Total number of started phases for a given action and with a given name per executor instance | * action - Action name (e.g. manualSnapshot, retire)* phase - Phase name (e.g. copySnapshots, reportMetrics) |
exec_phase_error_count_total |
counter |
Total number of errors for a given action and phase per executor instance | * action - Action name (e.g. manualSnapshot, retire)* phase - Phase name (e.g. copySnapshots, reportMetrics) |
Rate Limiter Metrics
These metrics might be useful for monitoring current pressure:
| Name | Type | Description | Labels |
|---|---|---|---|
limiter_inflight_count |
gauge |
Number of in-flight operations | * operation - Operation name (e.g. csiSnapshot, genericCopy) |
limiter_pending_count |
gauge |
Number of pending operations | * operation - Operation name (e.g. csiSnapshot, genericCopy) |
limiter_request_seconds |
histogram |
Duration in seconds of: * how long operation wait for the token (label stage = wait)* how long operation hold the token (label stage = hold) |
* operation - Operation name (e.g. csiSnapshot, genericCopy)* stage - This label indicates the essence of the metric. Can be wait or hold. See description for more details |
Jobs Metrics
These metrics measure the time range between the creation of the job and its completion:
| Name | Type | Description | Labels |
|---|---|---|---|
jobs_completed |
gauge |
Number of finished jobs (the job is considered to be finished if it has failed, skipped, or succeeded status) | * status - Status name (e.g. succeeded, failed) |
jobs_duration |
histogram |
Duration in seconds of completed Veeam Kasten jobs. | * status - Status name (e.g. succeeded, failed)* policy_id - Policy ID (e.g. 264aae0e-07ac-4aa5-a38f-aa131c053cbe, UNKNOWN) |
The jobs_duration metric is the easiest one for monitoring job status
because it is already aggregated. This metric captures the running time
of jobs that have completed, whether they succeed or fail.
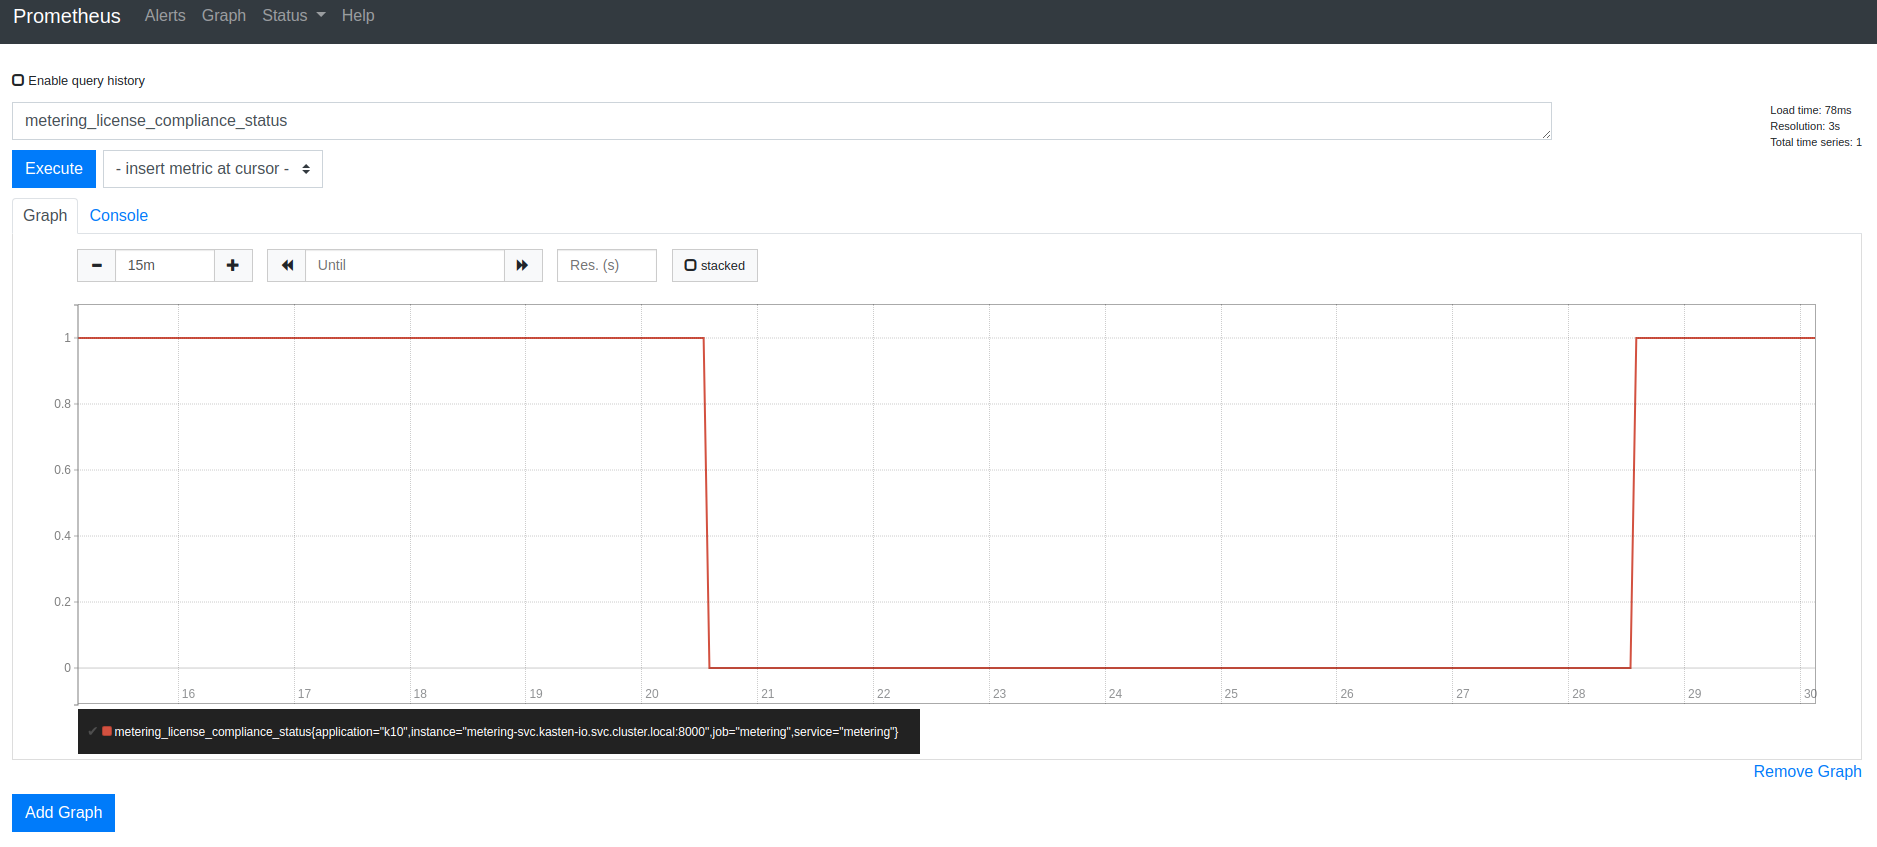
Veeam Kasten License Status
Veeam Kasten exports the metering_license_compliance_status metric
related to the cluster's license compliance. This metric contains
information on when the cluster was out of license compliance.
The metering_license_compliance_status metric is a Prometheus gauge,
and has a value of 1 if the cluster's license status is compliant and 0
otherwise. To see the timeline of when Veeam Kasten was out of license
compliance, the metering_license_compliance_status metric can be
queried and graphed.
It is possible to see the
peak node usage for
the last two months e.g. by querying
node_usage_history{timePeriod="202210"}. The label format is YYYYMM.
Veeam Kasten Status Metrics
The state of profiles and policies can be monitored with
profiles_count and policies_count respectively.
profiles_count{type="Location", status="Failed"} reporting a value
greater than 0 would be grounds for further investigation as it would
create issues for any related policies. type="Infra" is also available
for Infrastructure profiles.
policies_count{action="backup", chained="export", status="Failed"}
reports on policies involving both a backup and export that are in a
failed state.
Veeam Kasten Storage Metrics
To check exported storage consumption (Object, NFS/SMB or Veeam Backup &
Replication) there is export_storage_size_bytes with types
[logical, physical], e.g. export_storage_size_bytes{type="logical"}.
The deduplication ratio is calculated by logical / physical.
snapshot_storage_size_bytes, also with logical and physical types,
reports the local backup space utilization.
Data Transfer Metrics
Metrics are collected for individual snapshot upload and download operation steps within Veeam Kasten export and import actions. These metrics differ from those collected for Veeam Kasten actions because they are captured on a per-volume basis, whereas Veeam Kasten actions, in general, could involve multiple volume operations and other activities.
The following data operations metrics are recorded:
| Metric Name | Type | Description |
|---|---|---|
data_operation_duration |
Histogram | This metric captures the total time taken to complete an operation. |
data_operation_normalized_duration |
Histogram | This metric captures the normalized time taken by an operation. The value is expressed in time/MiB. Normalized duration values allow comparisons between different time series, which is not possible for duration metric values due to the dependency on the amount of data transferred. |
data_operation_bytes |
Counter | This metric counts the bytes transferred by an operation, and is typically used to compute the data transfer rate. Note: This metric is not collected for Download operations involving the Filesystem export mechanism. |
data_operation_volume_count |
Gauge | This metric counts the number of volumes involved in an operation. It is set to 1 at the beginning of an operation and changes to 0 upon completion. When aggregated, it displays the total number of volumes being transferred over time. |
The following labels are applied to the operation metrics:
| Label Name | Description |
|---|---|
operation |
The type of operation: one of Upload or Download |
repo_type |
The type of LocationProfile object that identifies the storage repository: one of ObjectStore, FileStore or VBR. |
repo_name |
The name of the LocationProfile object that identifies the storage repository. |
data_format |
The export mechanism used: one of Filesystem or Block. |
namespace |
The namespace of the application involved. |
pvc_name |
The name of the PVC involved. |
storage_class |
The storage class of the PVC involved. |
Upload operation metrics do not include the time taken to snapshot the volumes or the time to upload the action's metadata. However, they do include the time taken to instantiate a PersistentVolume from a snapshot when needed. Similarly, Download operation metrics do not involve the allocation of the PersistentVolume or the node affinity enforcement steps.
Some query examples:
## average duration over 2-minute intervals
sum by (data_format,operation,namespace,pvc_name) (rate(data_operation_duration_sum{}[2m]))
/ sum by (data_format,operation,namespace,pvc_name) (rate(data_operation_duration_count{}[2m]))

## average transfer rate over 2-minute intervals
avg by (data_format, operation, storage_class, repo_name) (rate(data_operation_bytes{}[2m]))

## count of data transfer operations over 2-minute intervals
sum (max_over_time(data_operation_volume_count{}[2m]))
When a Veeam Backup Repository is involved, additional metrics are recorded:
| Metric Name | Type | Description |
|---|---|---|
data_upload_session_duration |
Histogram | This metric captures the total time taken for an upload session. |
data_upload_session_volume_count |
Gauge | This metric counts the number of volumes in an upload session. When aggregated, it shows the total number of volumes across all upload sessions over time. |
The following labels are applied to the upload session metrics:
| Label Name | Description |
|---|---|
repo_type |
The type of LocationProfile object that identifies the storage repository: VBR. |
repo_name |
The name of the LocationProfile object that identifies the storage repository. |
namespace |
The namespace of the application involved. |
A query example:
## count of volumes involved in VBR upload sessions over 2-minute intervals
sum (max_over_time(data_upload_session_volume_count{repo_type="VBR"}[2m]))
Veeam Kasten Multi-Cluster Metrics
The Multi-Cluster primary instance exports the following metrics collected from all clusters within the multi-cluster system.
Use the cluster label with cluster name as the value to query metrics
for an individual cluster.
For example, to query the number of successful actions in the past 24 hours:
sum(round(increase(mc_action_ended_count{state="succeeded",cluster="<cluster-name>"}[24h])))
Policy Metrics
| Name | Type | Description | Labels |
|---|---|---|---|
mc_policies_count |
gauge |
Number of policies in cluster | * cluster - Cluster name |
mc_compliance_count |
gauge |
Number of namespaces by compliance state. See Veeam Kasten Compliance Metrics about exclusions | * cluster - Cluster name* state - Compliance state (e.g. Compliant, NotCompliant, Unmanaged) |
Action Metrics
| Name | Type | Description | Labels |
|---|---|---|---|
mc_action_ended_count |
counter |
Number of actions that have ended | * cluster - Cluster name* state - Terminal state (e.g. cancelled, failed, succeeded) |
mc_action_skipped_count |
counter |
Number of actions that were skipped | * cluster - Cluster name |
Storage Metrics
| Name | Type | Description | Labels |
|---|---|---|---|
mc_export_storage_physical_size_bytes |
gauge |
Exported storage consumption in bytes | * cluster - Cluster name |
mc_snapshot_storage_physical_size_bytes |
gauge |
Local backup space utilization in bytes | * cluster - Cluster name |
Generating Reports
Veeam Kasten Reporting provides regular insights into key performance and operational states of the system. It uses prometheus to obtain information about action runs and storage consumption. For more information about Veeam Kasten Reporting, see Reporting