Dashboard Overview
The Veeam Kasten dashboard is broken up into a number of different sections. A brief description about each is provided below.
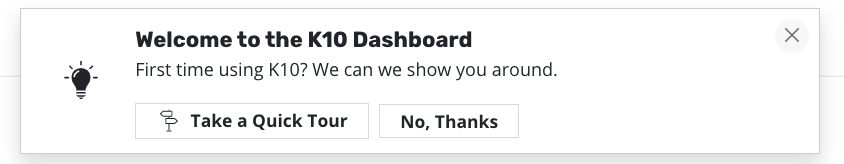
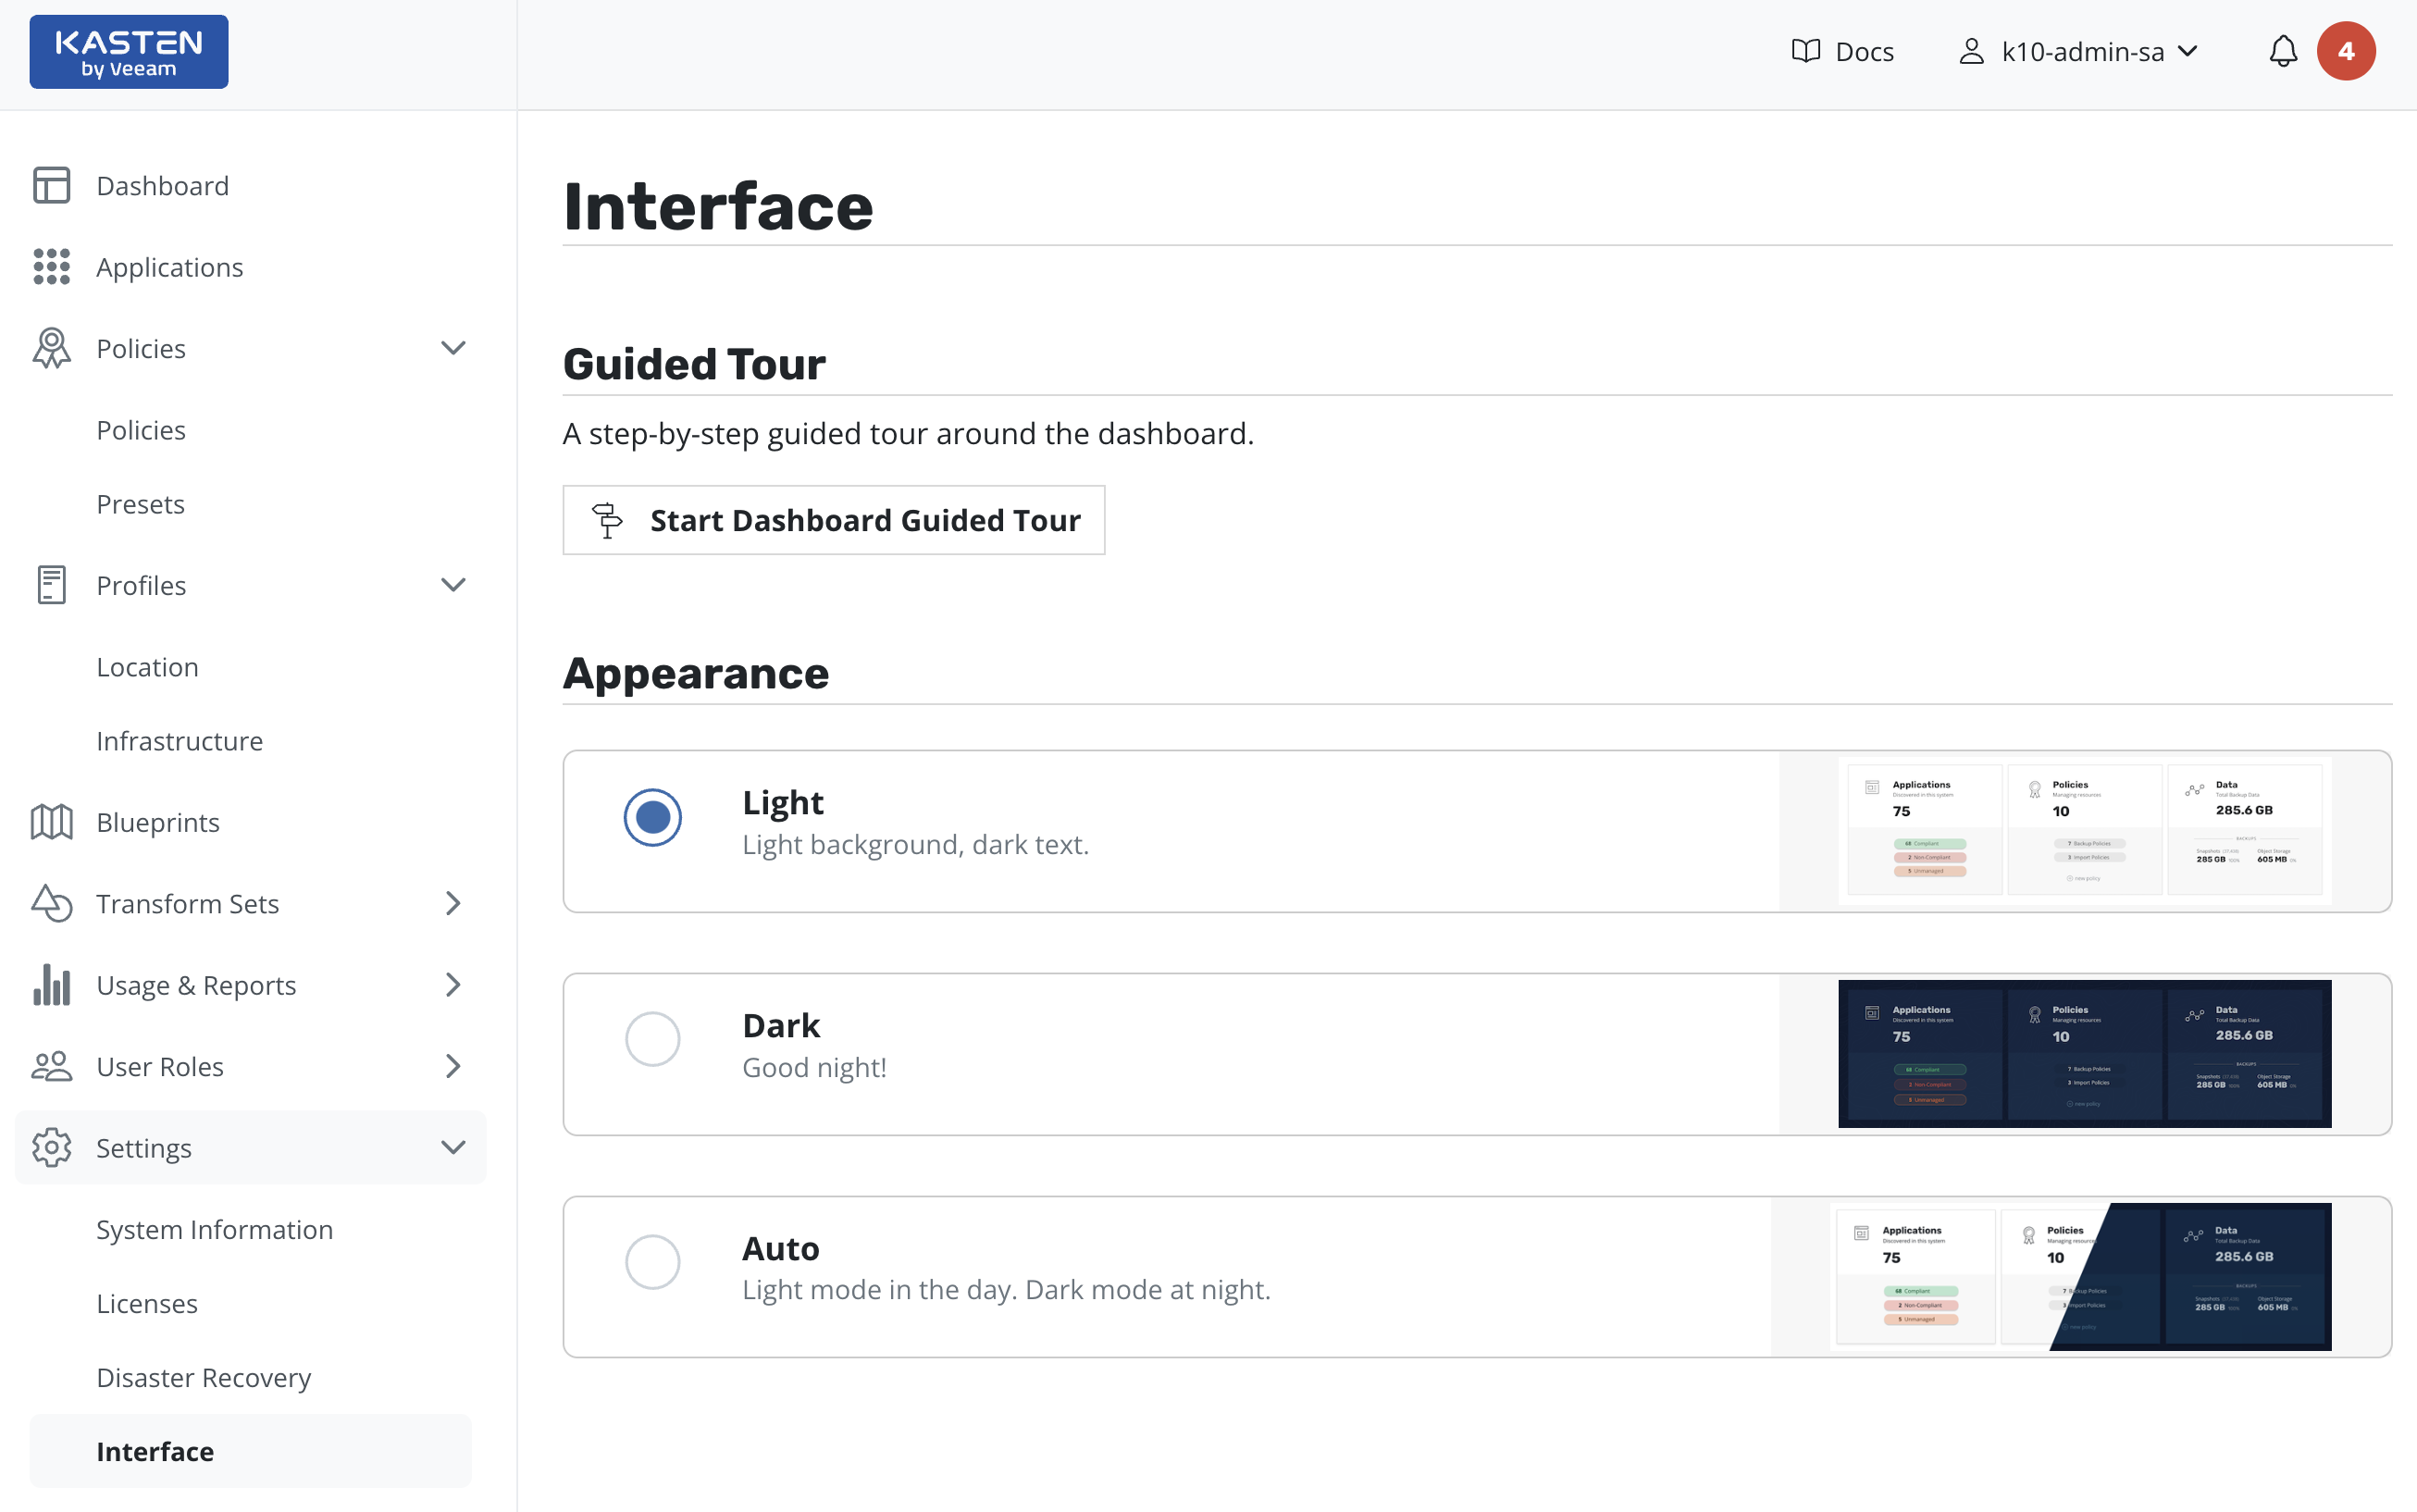
It is also possible to perform an interactive walkthrough of the Veeam
Kasten dashboard via a Guided Tour. The tour is available when the Veeam
Kasten dashboard is accessed for the first time or via the Interface
page of the Settings menu
in the navigation sidebar.
System Overview
The top of the Veeam Kasten dashboard displays a list of applications (currently mapped to namespaces), any policies that might exist in the system, and a summary of the cluster's backup data footprint.
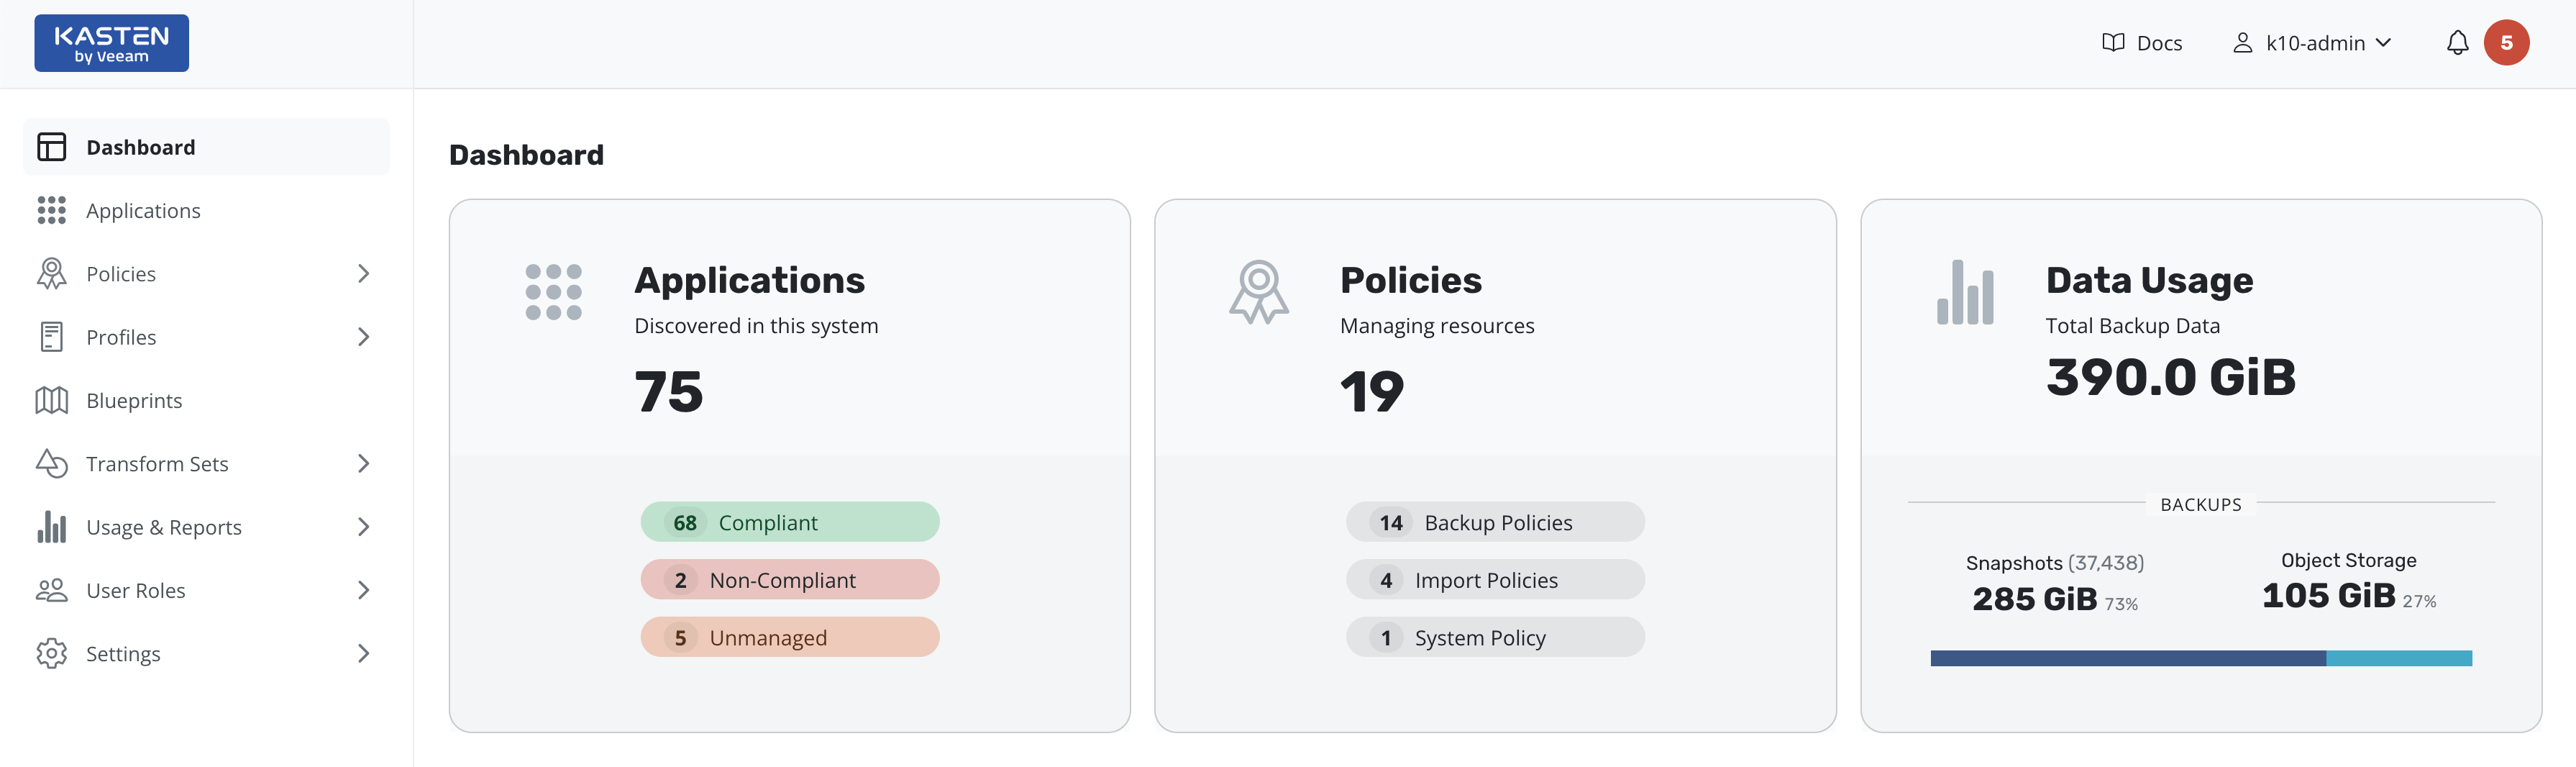
After filtering to only include applications that have stateful services (defined as containing a persistent volume), the above screen breaks down each section into three categories:
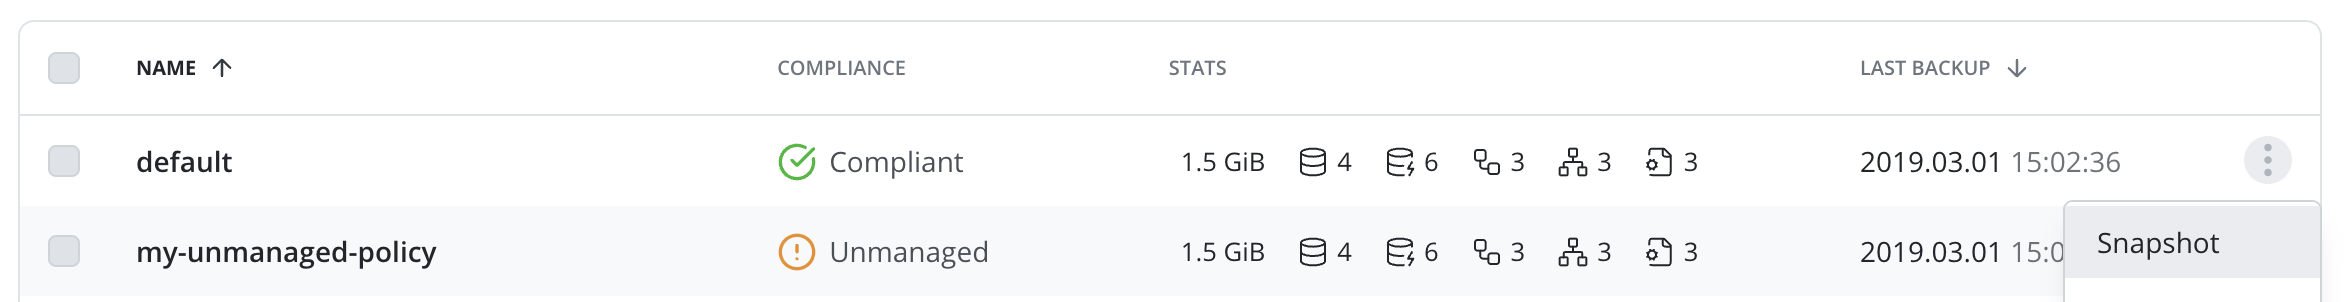
- Unmanaged: There are no protection policies that cover this object
- Non-compliant: A policy applies to this object but the actions associated with the policy are failing (e.g., due to underlying storage slowness, configuration problems, etc.) or the actions haven't been invoked yet (e.g., right after policy creation)
- Compliant: Objects that both policies apply to and the policy SLAs are being respected
- Removed: Objects that are removed.
Applications, Namespaces, and Workloads
The Veeam Kasten platform by default equates namespaces to applications for ease of use and consistency with Kubernetes best practices, use of RBAC, and to mirror the most common application deployment pattern. However, as shown later, policies can be defined to operate on more than one namespace or only operate on a subset of an application residing in a single namespace.
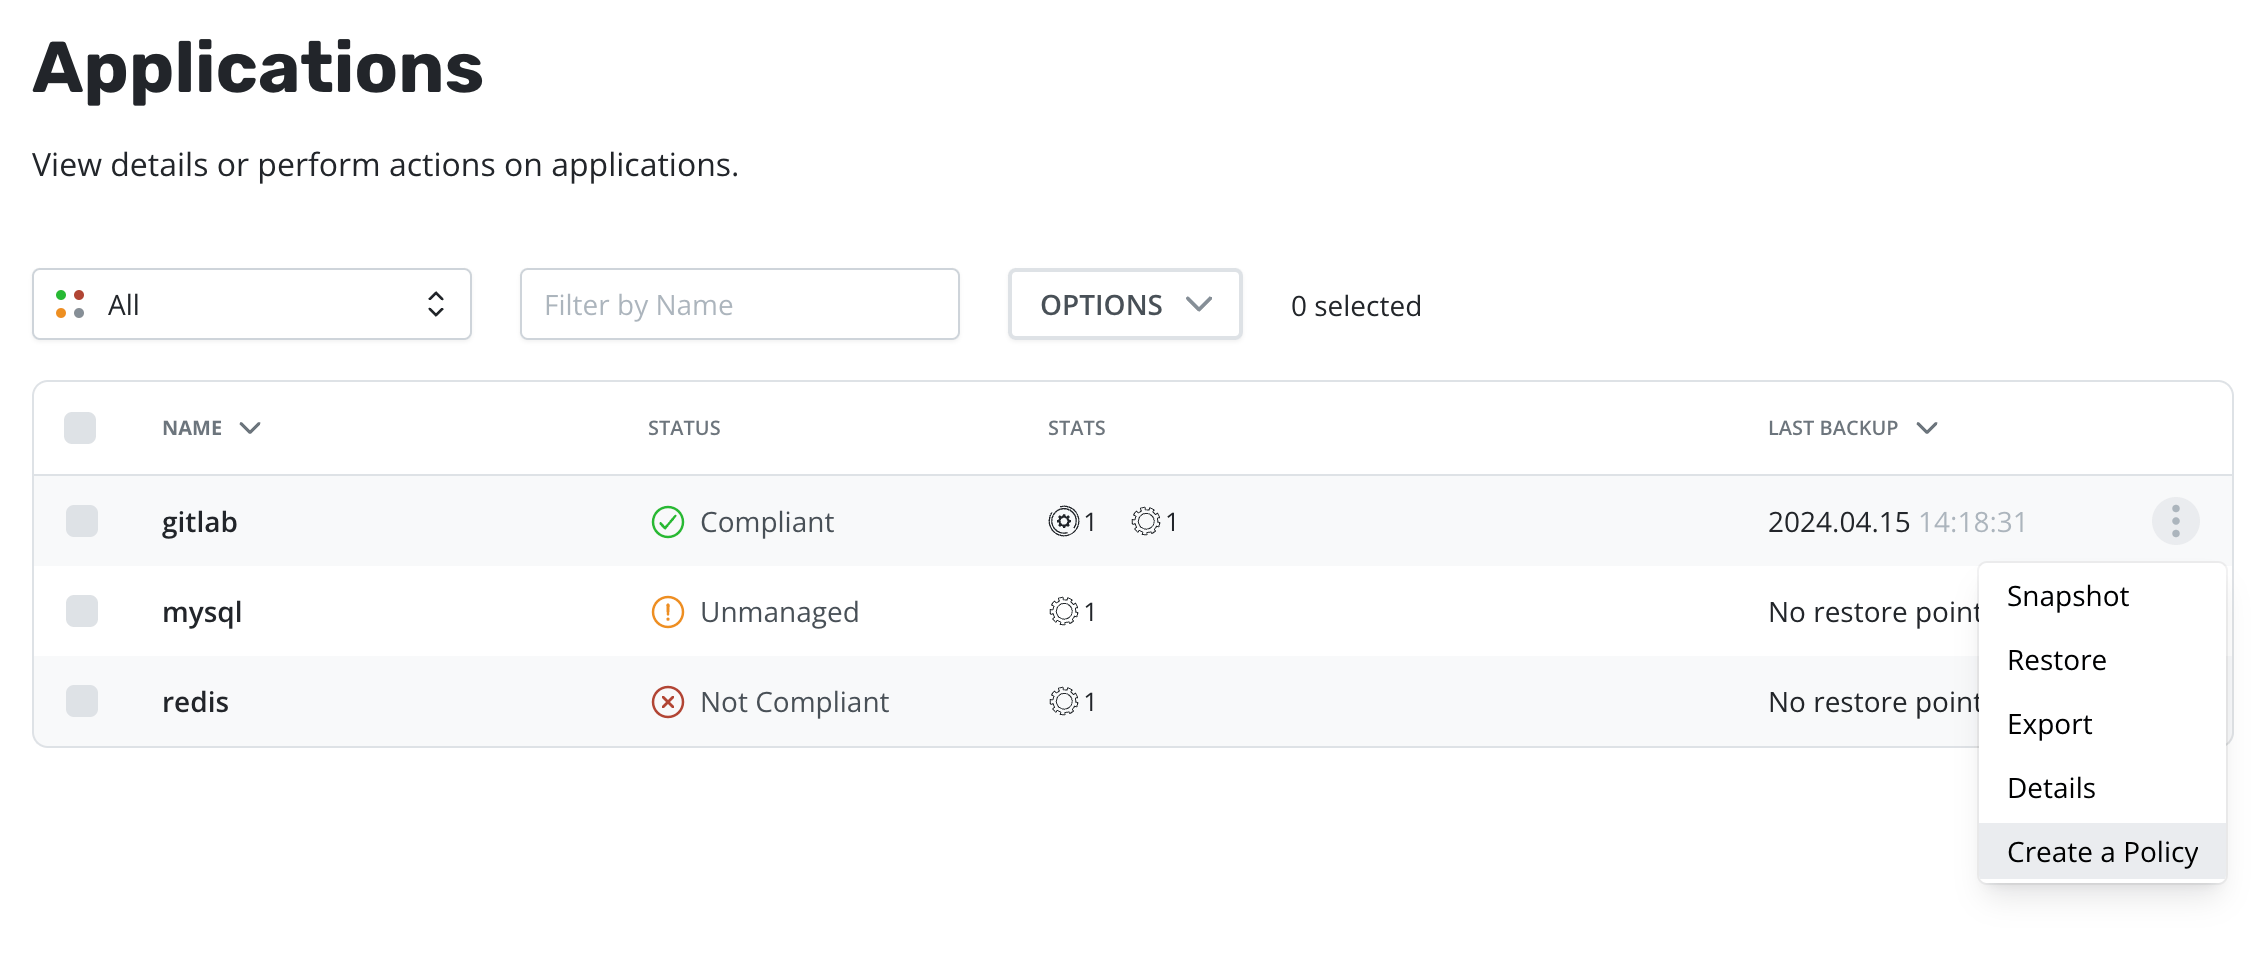
Assuming you have already installed applications, clicking on the Applications card on the dashboard will take you to the following view. Choosing one of the Compliant/Non-Compliant/Unmanaged/Removed buttons, it would automatically filter the applications. The cluster-scoped Options lists down the options that can be performed on the cluster scoped resources.
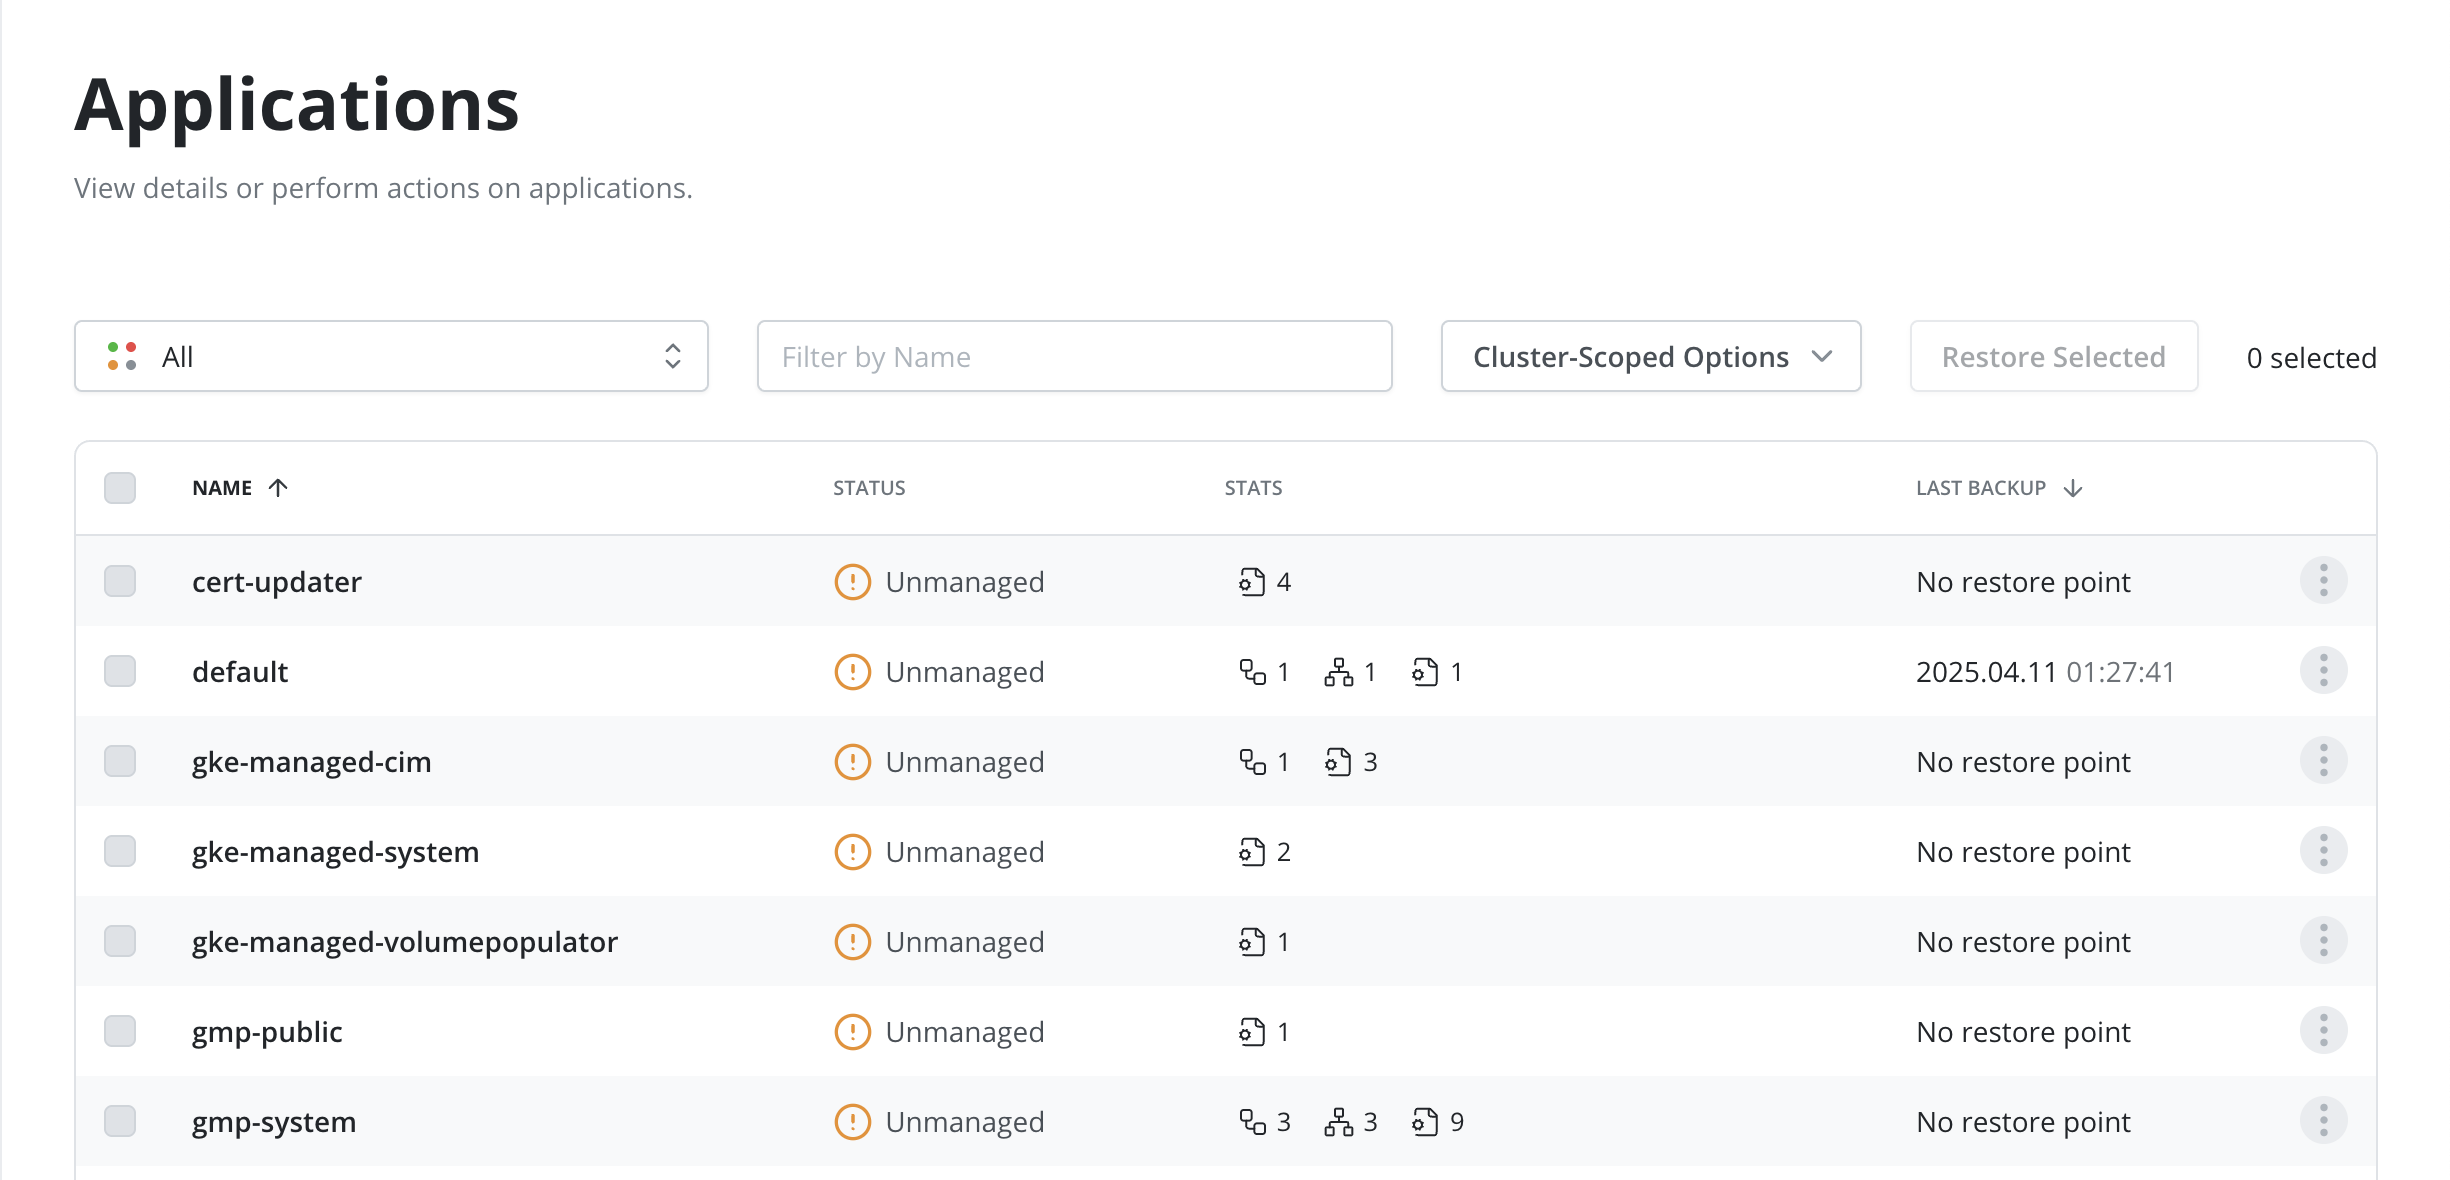
Veeam Kasten classifies Pods, VirtualMachines, StatefulSets, Deployments and DeploymentConfigs as workloads.
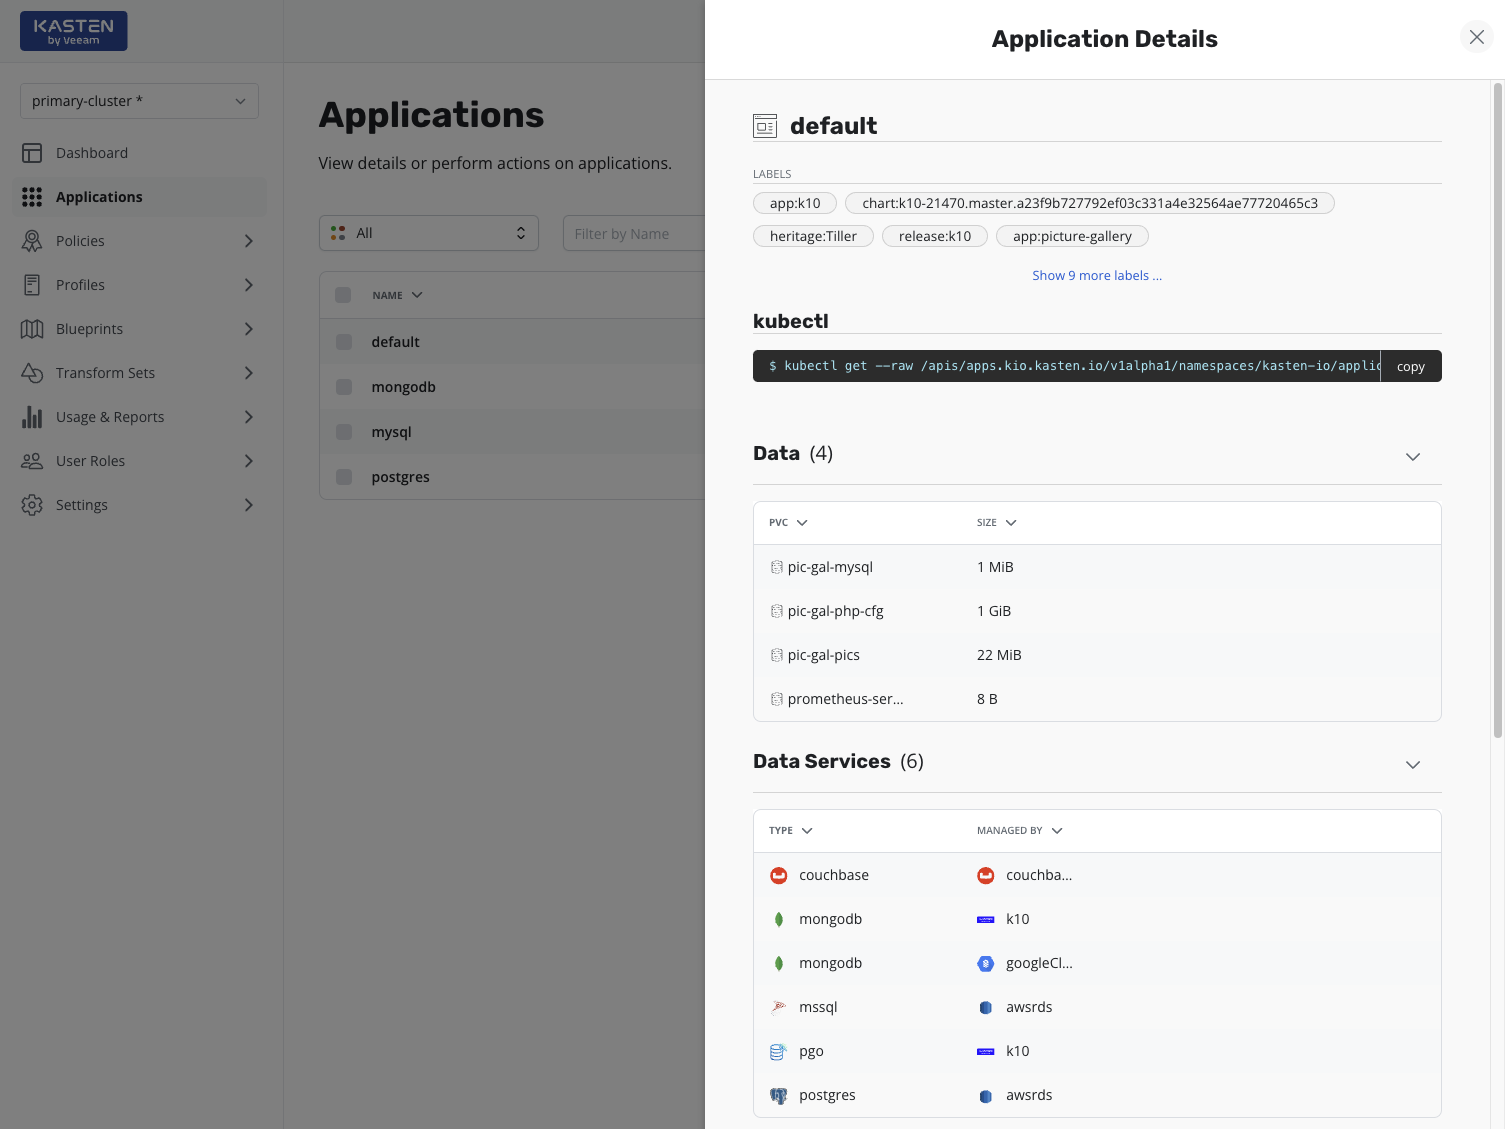
An application, in turn, is made up of multiple Kubernetes resources and workloads. In the above diagram, the GitLab card shows that the application is composed of four volumes, seven network resources, three workloads, and two other pieces of application configuration. You can get more information about the application by clicking on the details icon.
Restore Points
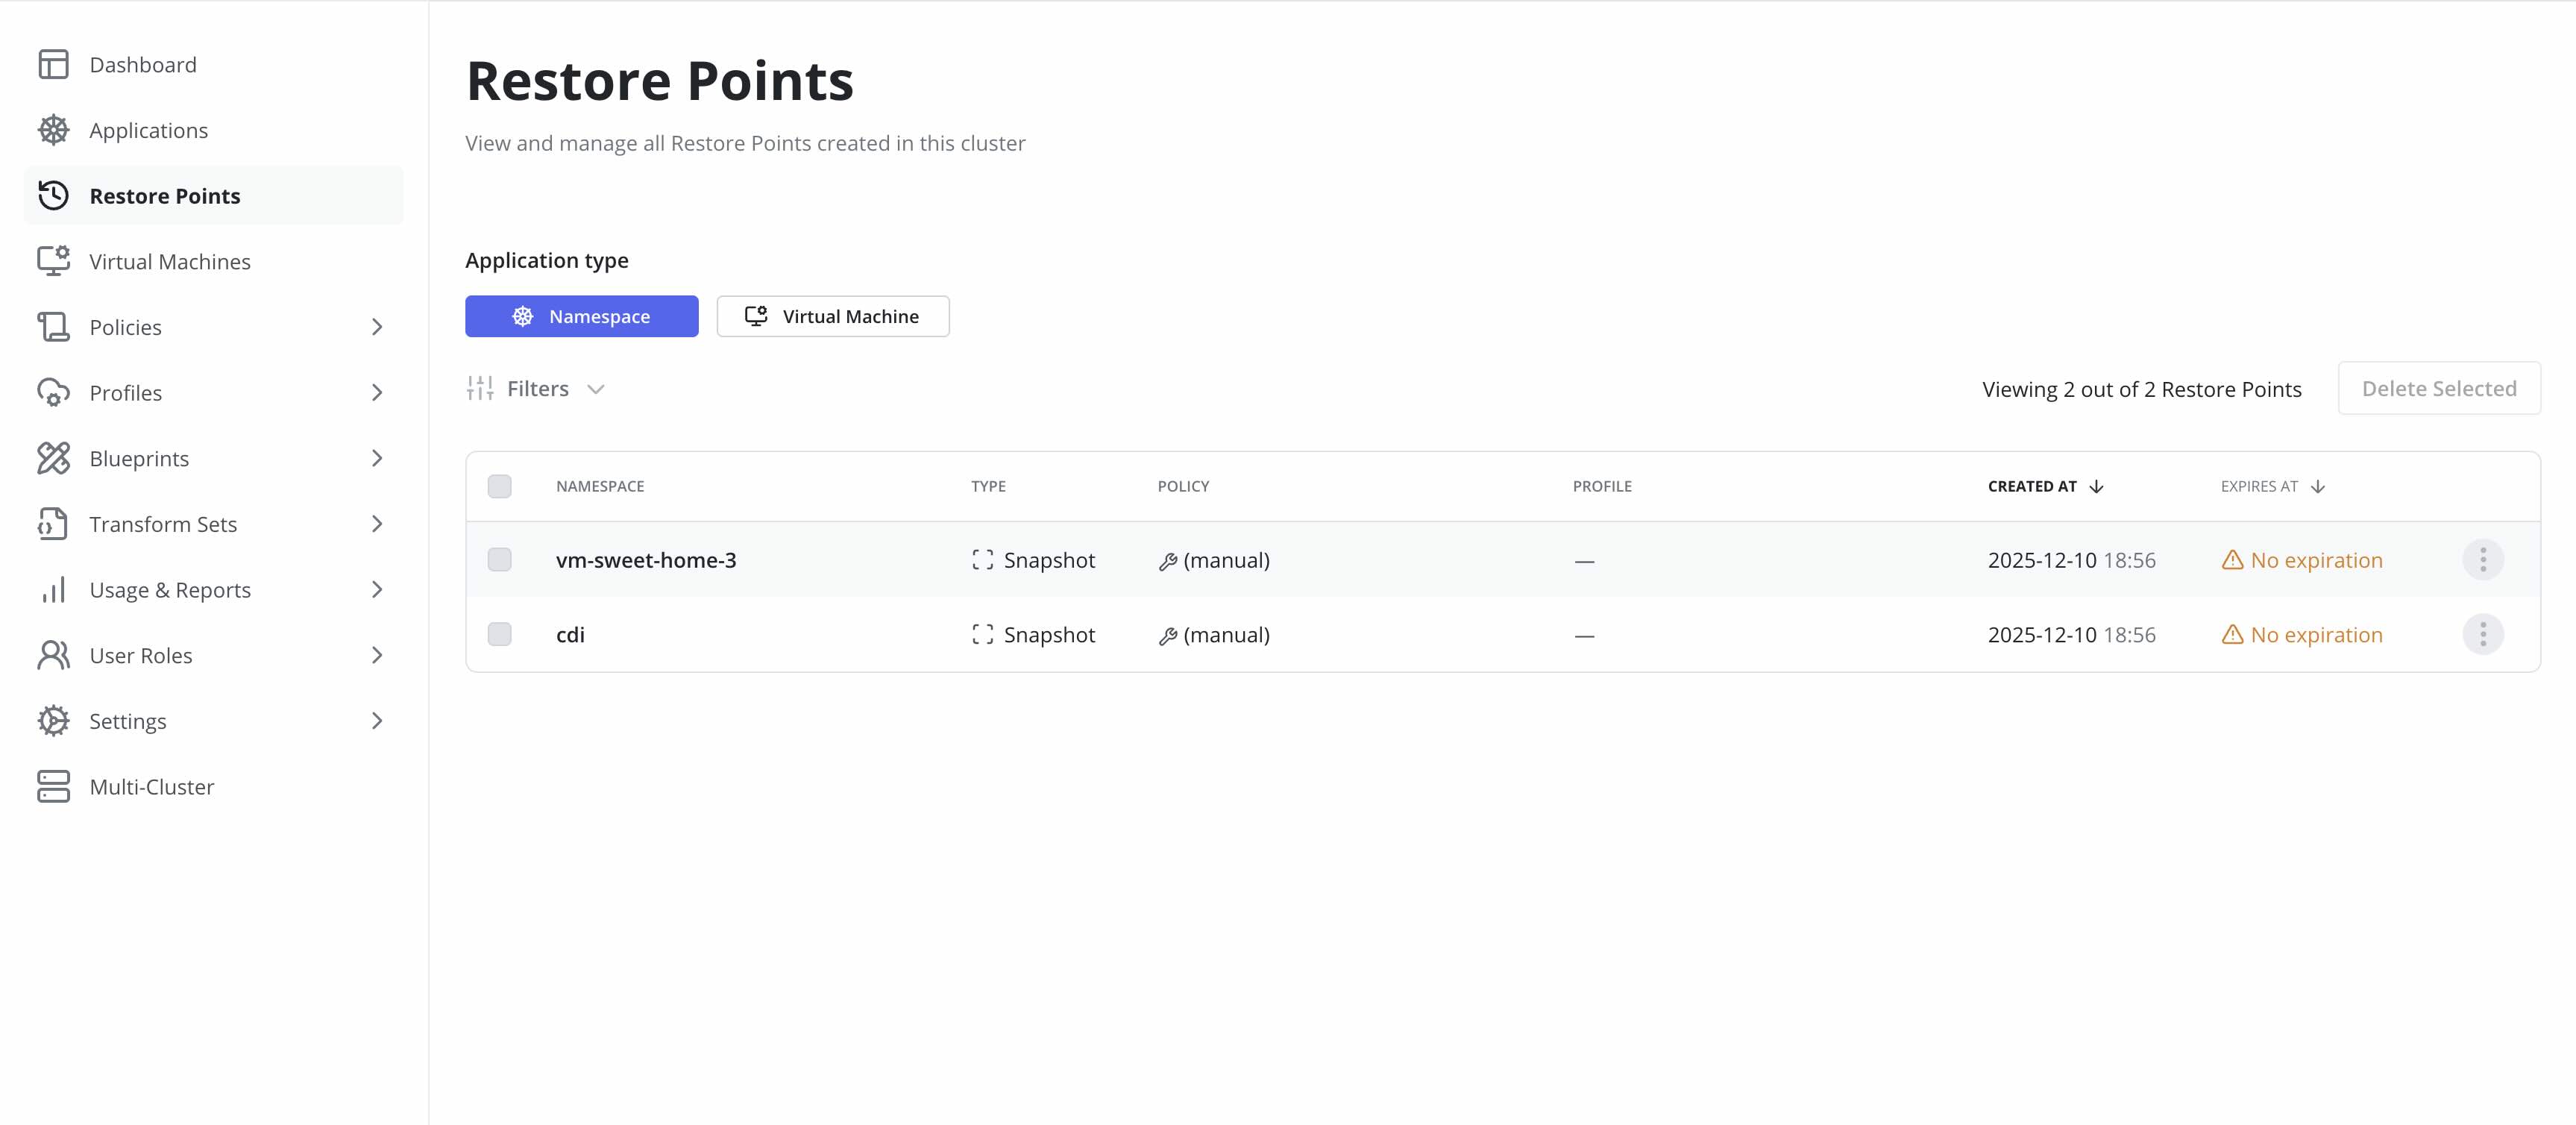
The Veeam Kasten UI has a centralized view for listing all the restore points created or imported by the cluster. It is accessed by clicking on the Restore Points item in the left side menu.
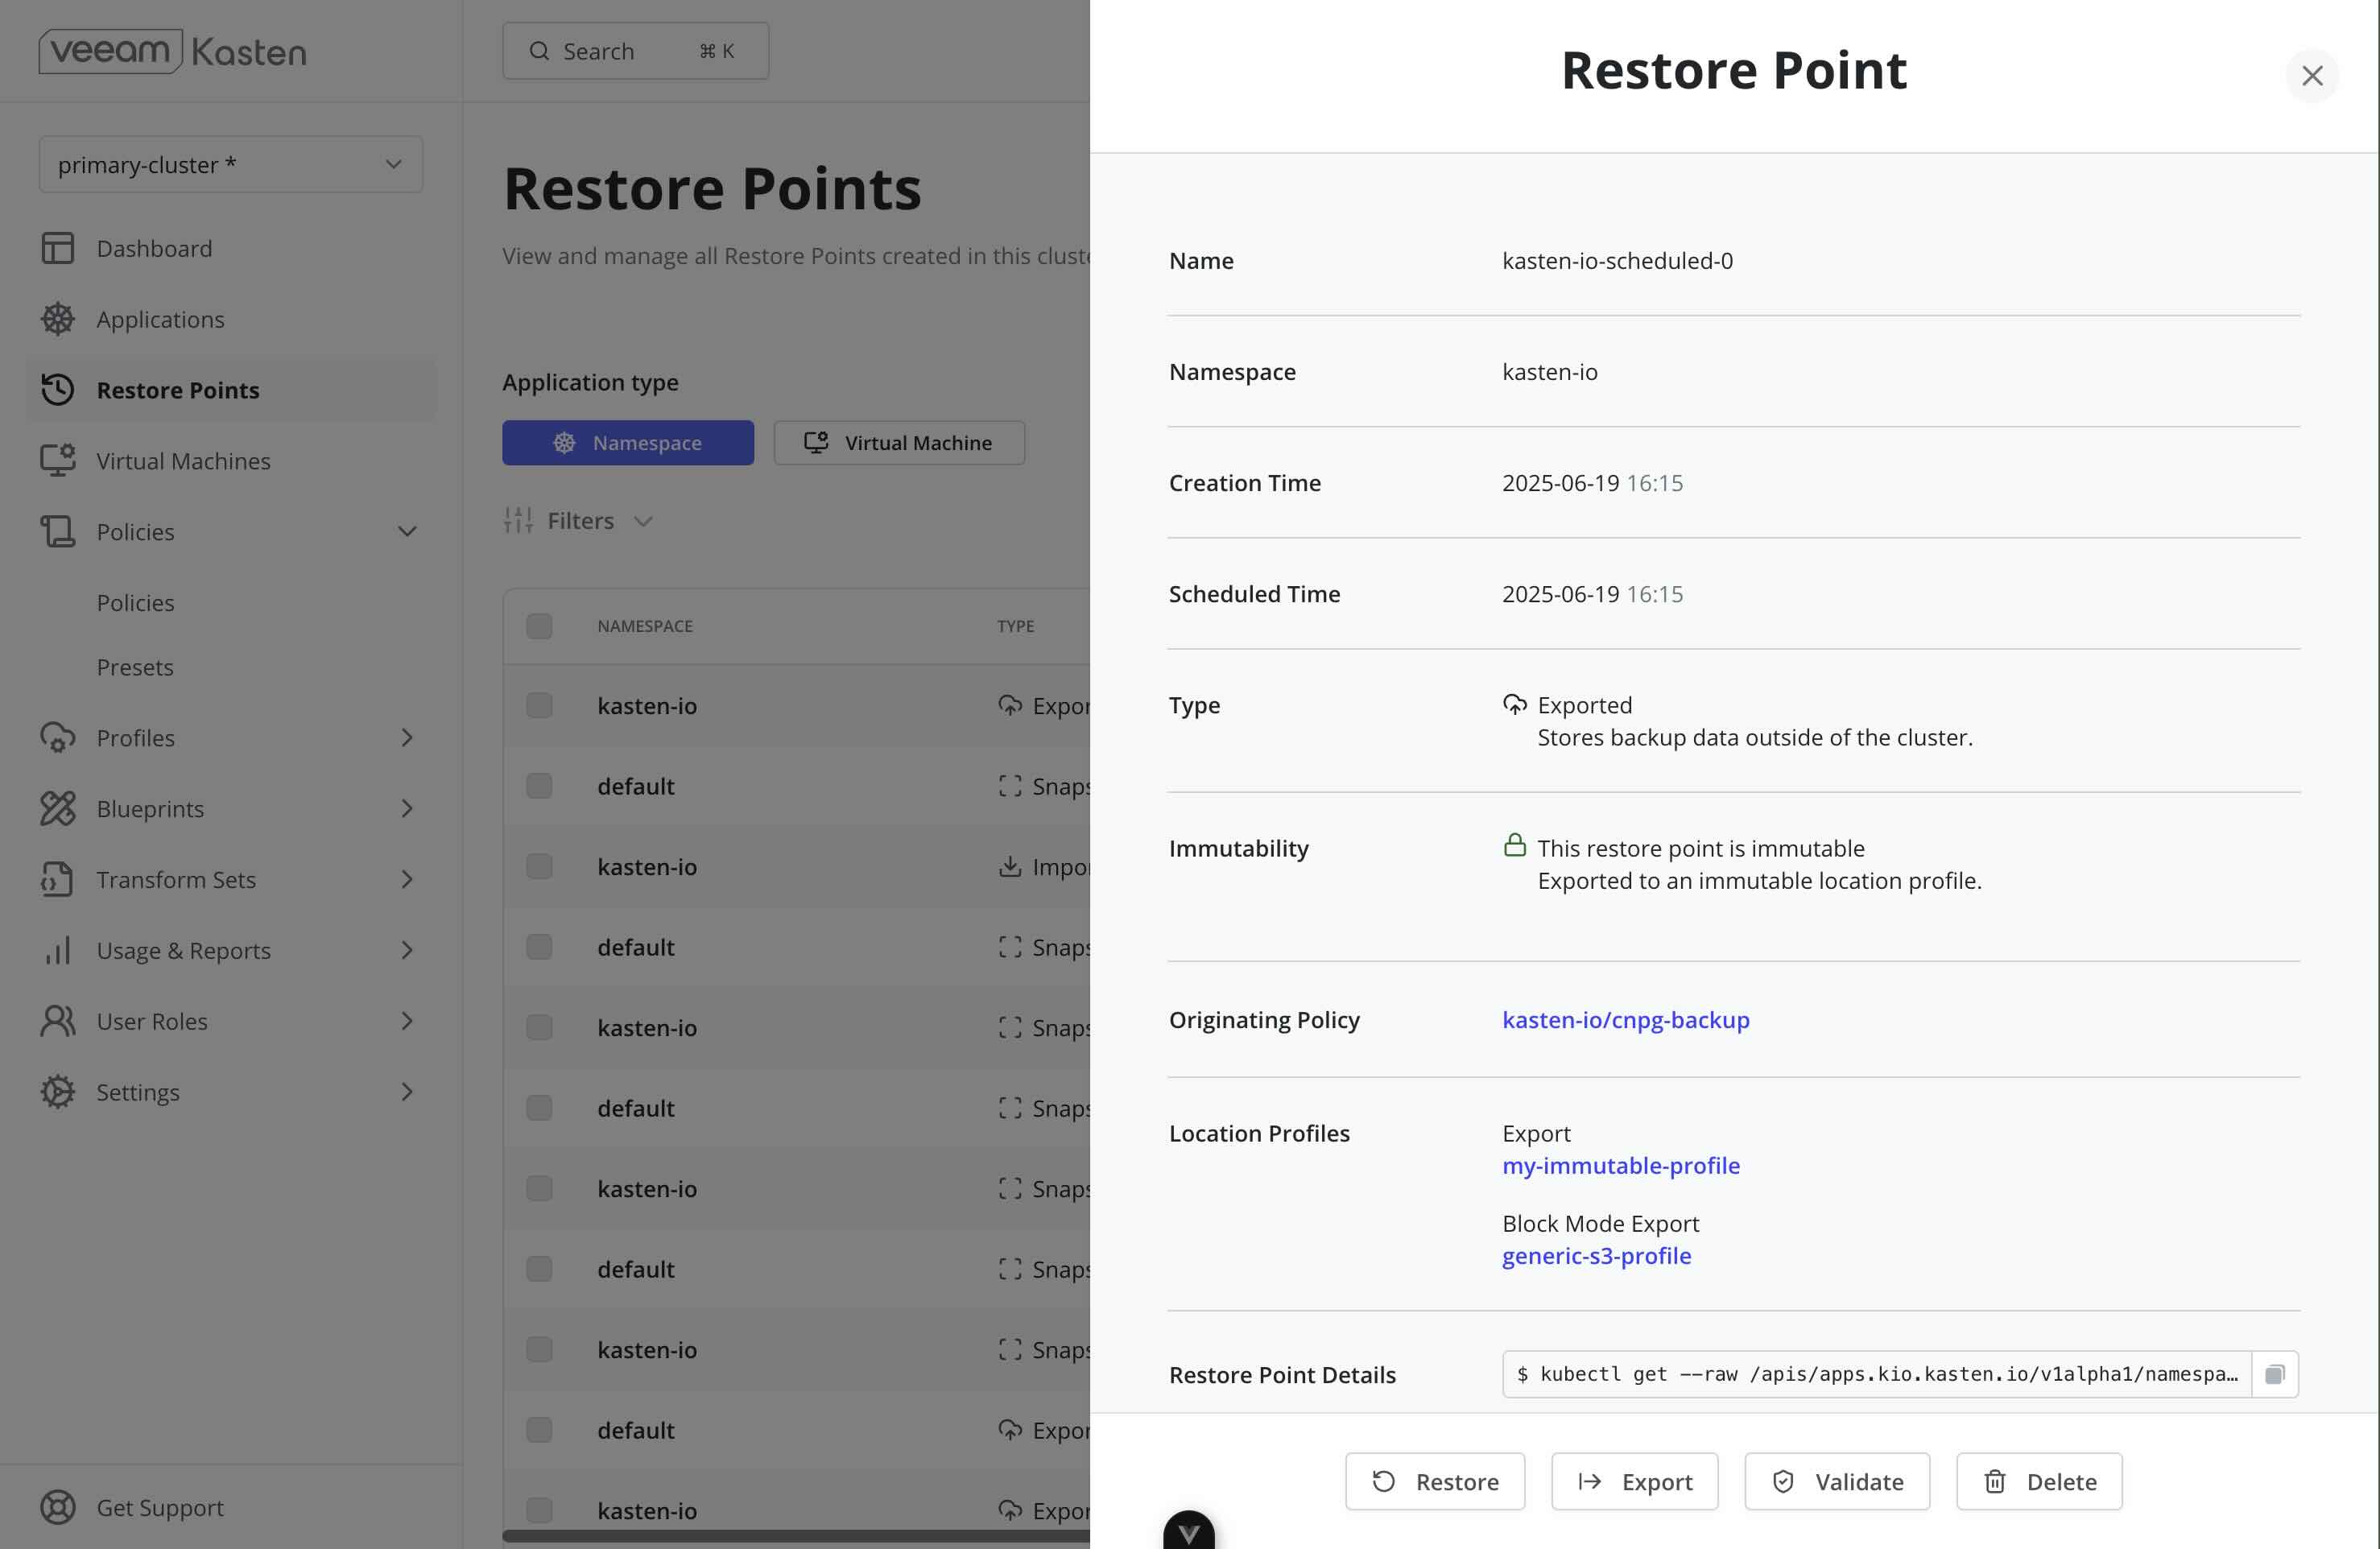
Clicking on a specific restore point will provide additional details. From there, the namespace or VM can be restored by clicking on the Restore button:
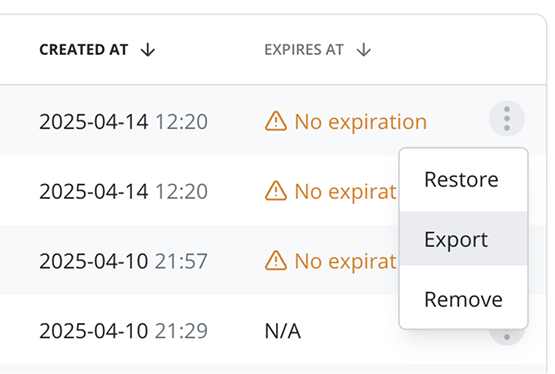
Additionally, local restore points can be exported by clicking on the Export option in the dropdown menu:
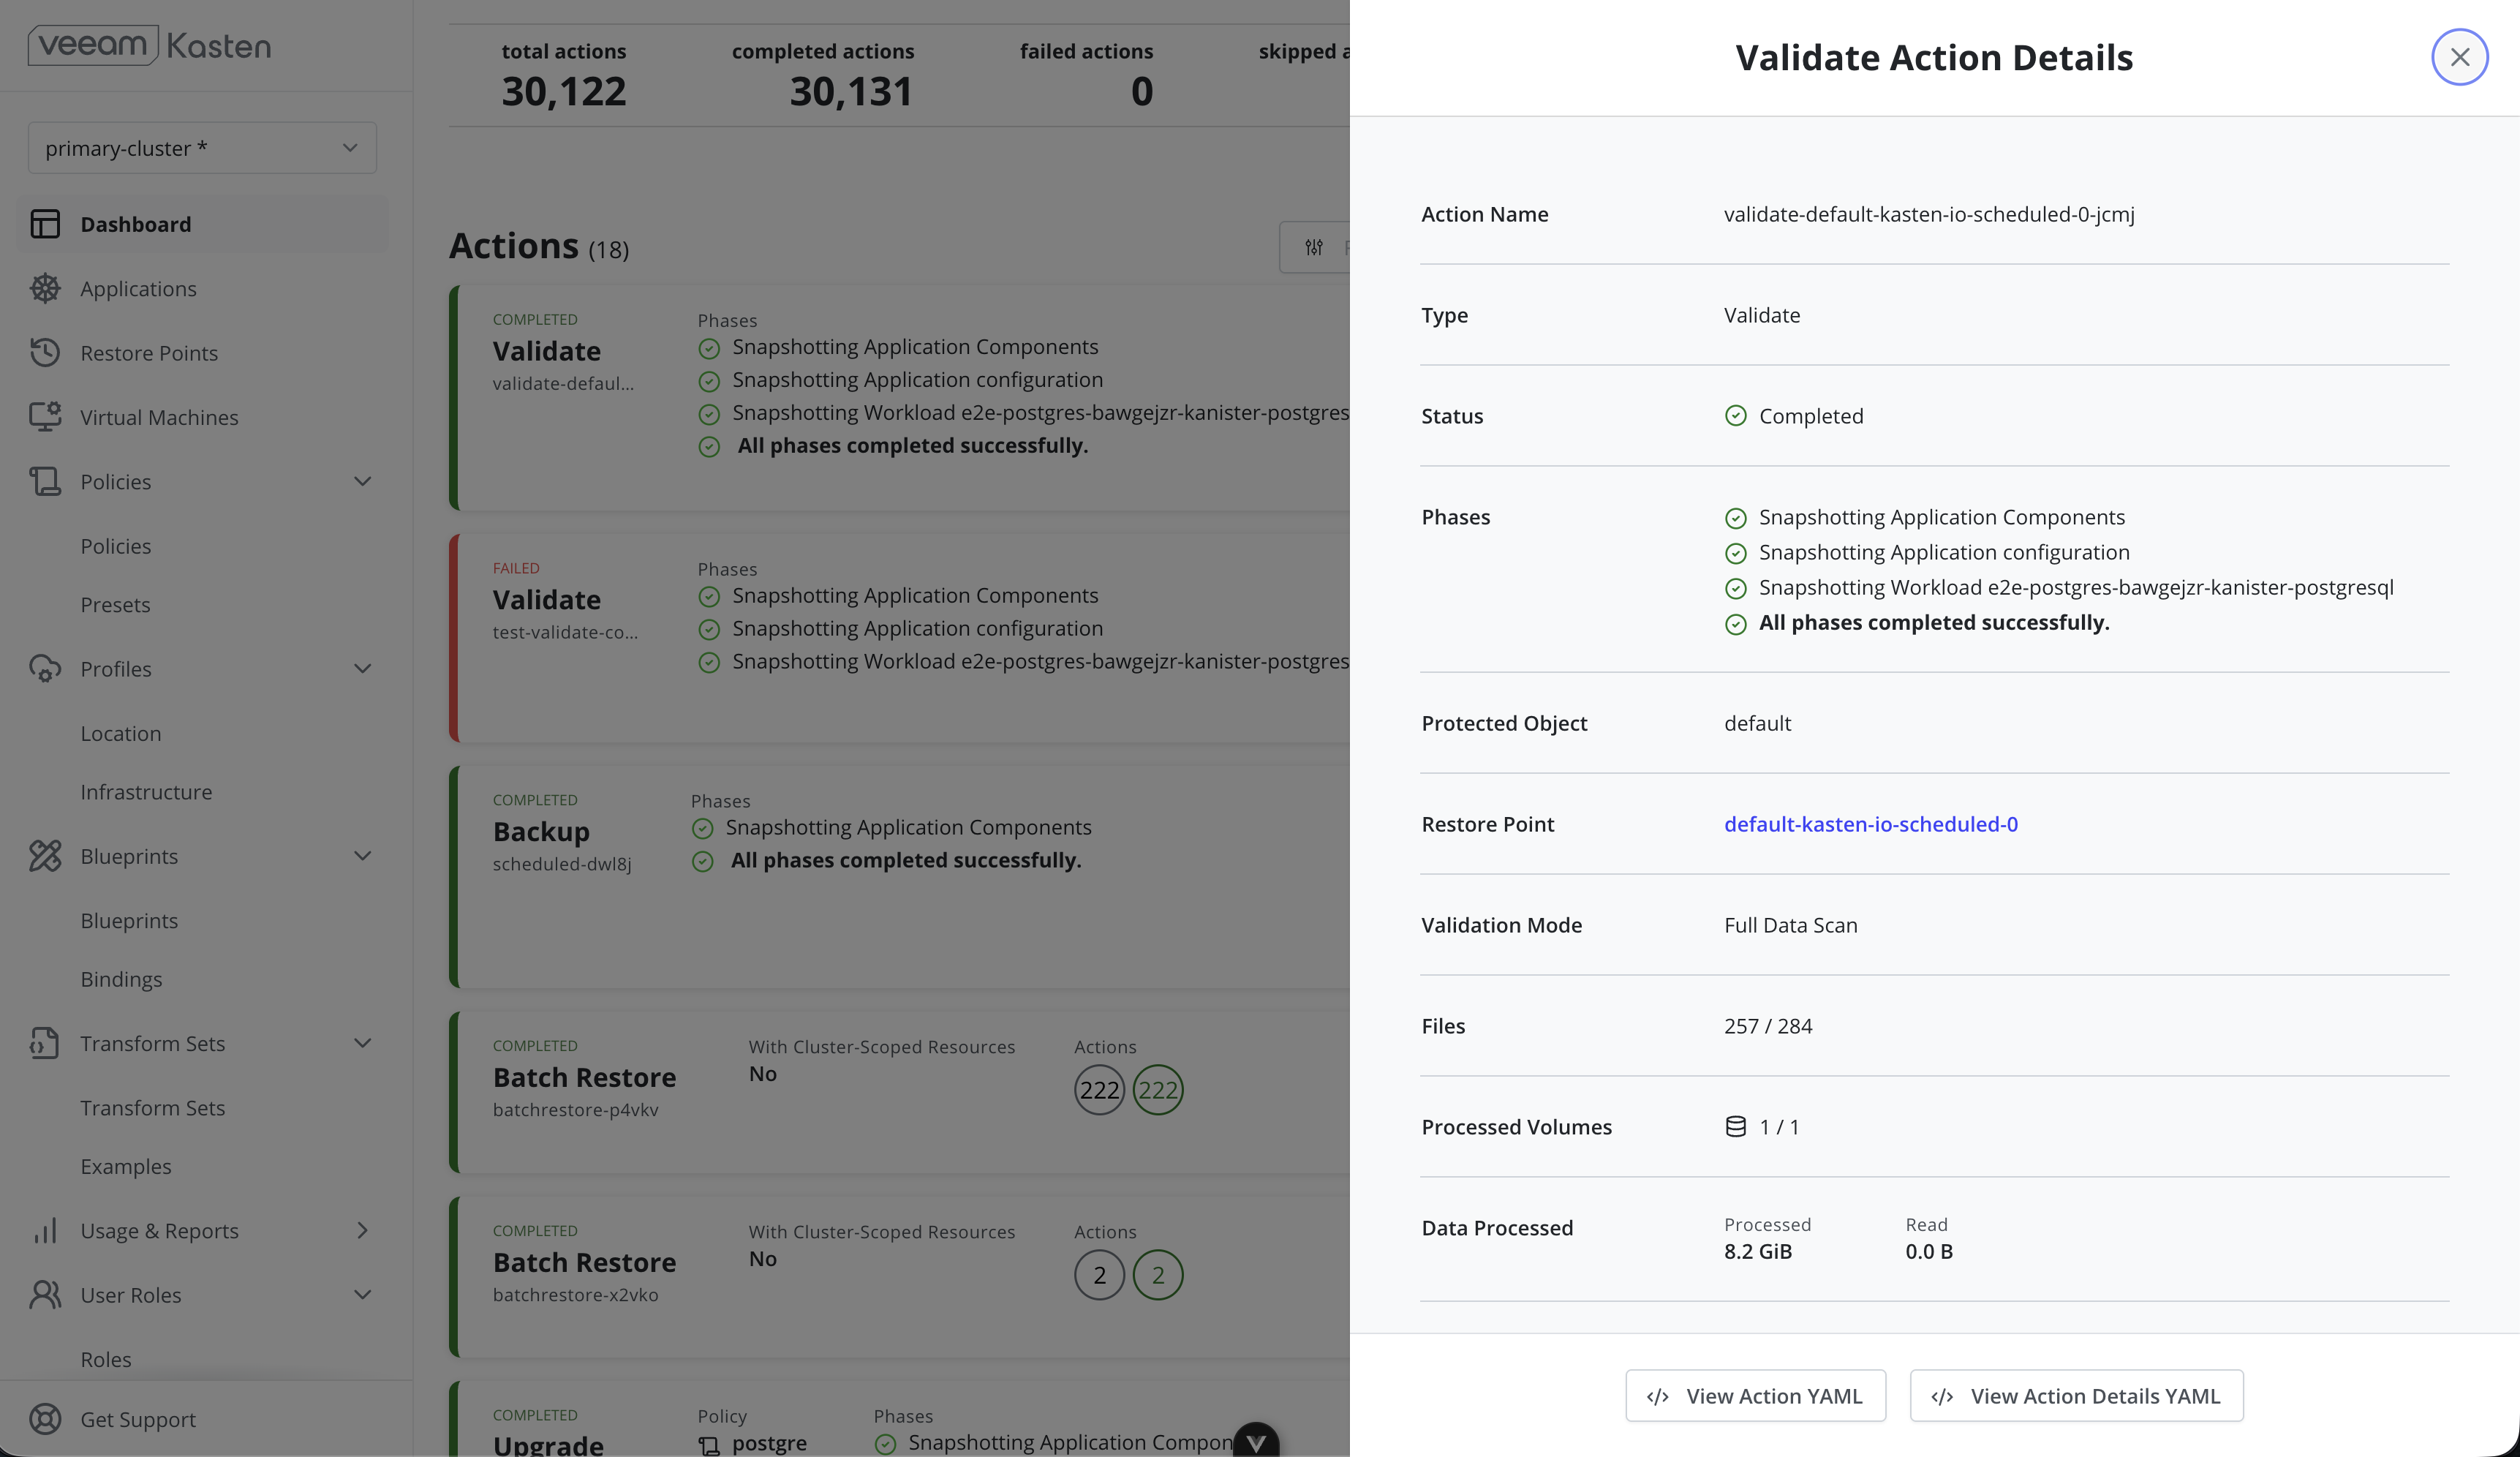
Exported restore points can be validated by selecting the Validate option in the dropdown menu:
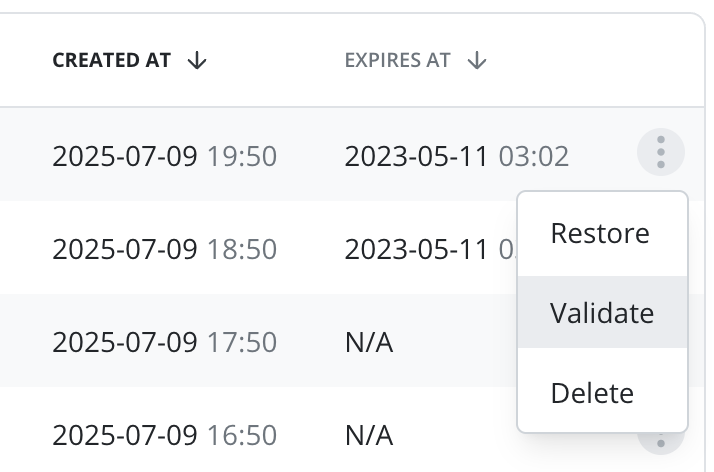
Restore points can be deleted, either in bulk by selecting them first, or individually by using the action dropdown menu:
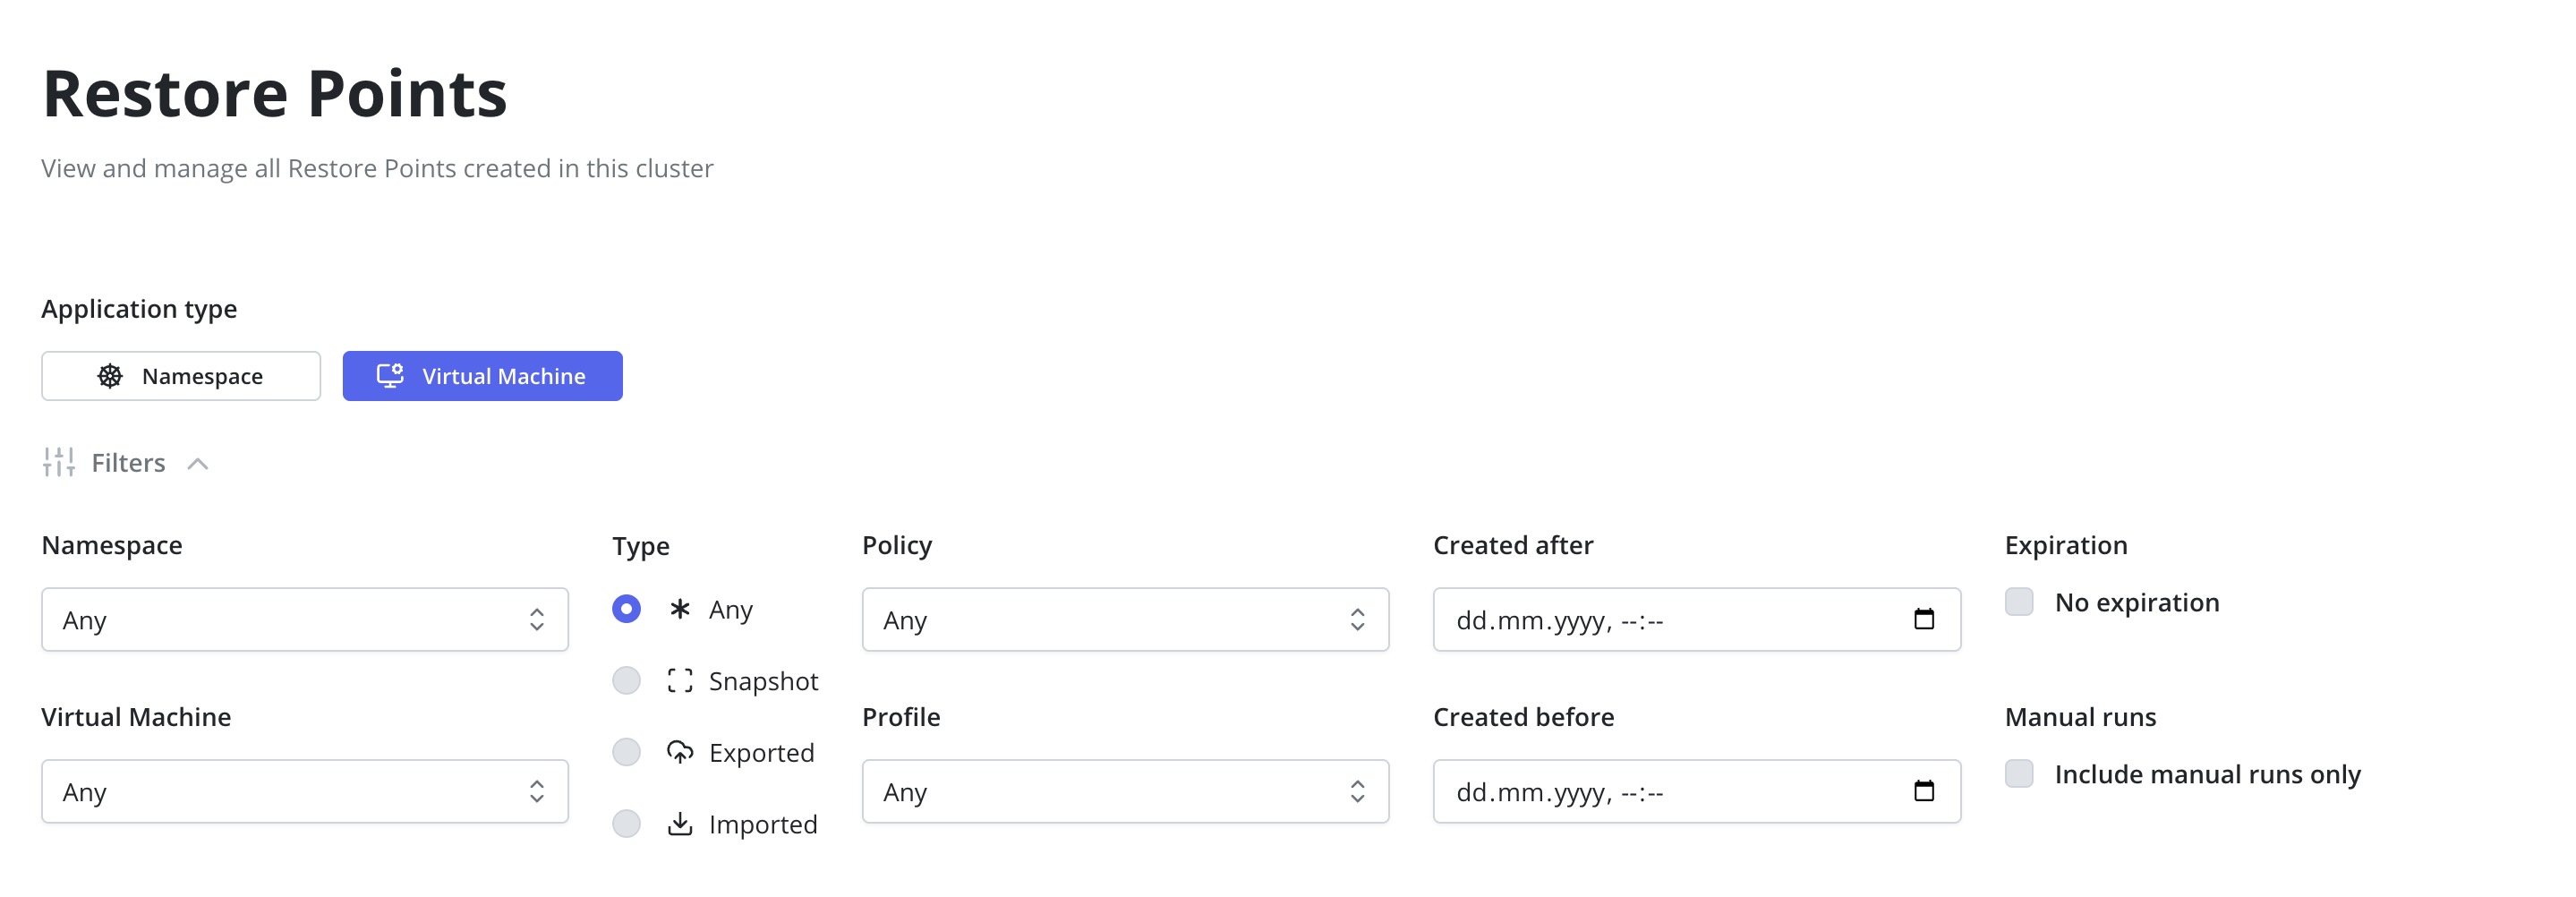
The Restore Points page provides rich filtering capabilities. Users can choose between namespace-based or VM-based backups, and filter further based on name of protected resource, associated Policies, the Profile used for import/export and the creation date/time. Filtering by type allows users to identify local snapshot-based restore points, exported restore points managed by the cluster, or imported restore points created by another cluster.
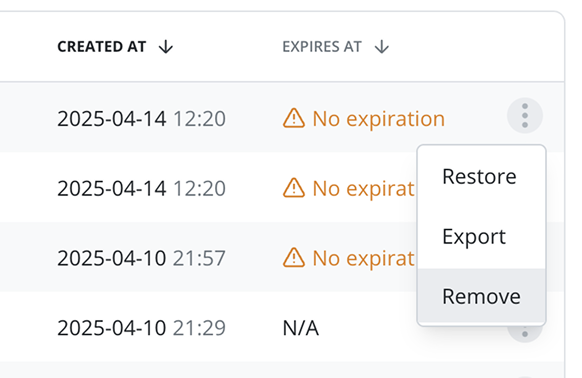
Selecting Include manual runs only will only list the restore points that were created by performing BackupActions or ExportActions not associated with a policy, or by manually executing a policy. Selecting No expiration lists the aforementioned manually created restore points that do not have a specified expiration date, allowing for simple identification and removal of orphaned backup data.
For namespace-based backups, the cluster-scoped option can be selected to view restore points that include cluster-scoped resources.
Policies
Within Veeam Kasten, policies define a selection of Kubernetes resources and one or more data management actions that are configured to occur on a periodic or event-driven basis.
On the main dashboard, the Policies card provides an overview of configured policy types. Selecting via the sidebar or the Policies card navigates to the Policies page, which lists all policies that have been created in the system. At the time of installation, no policies are created by default.
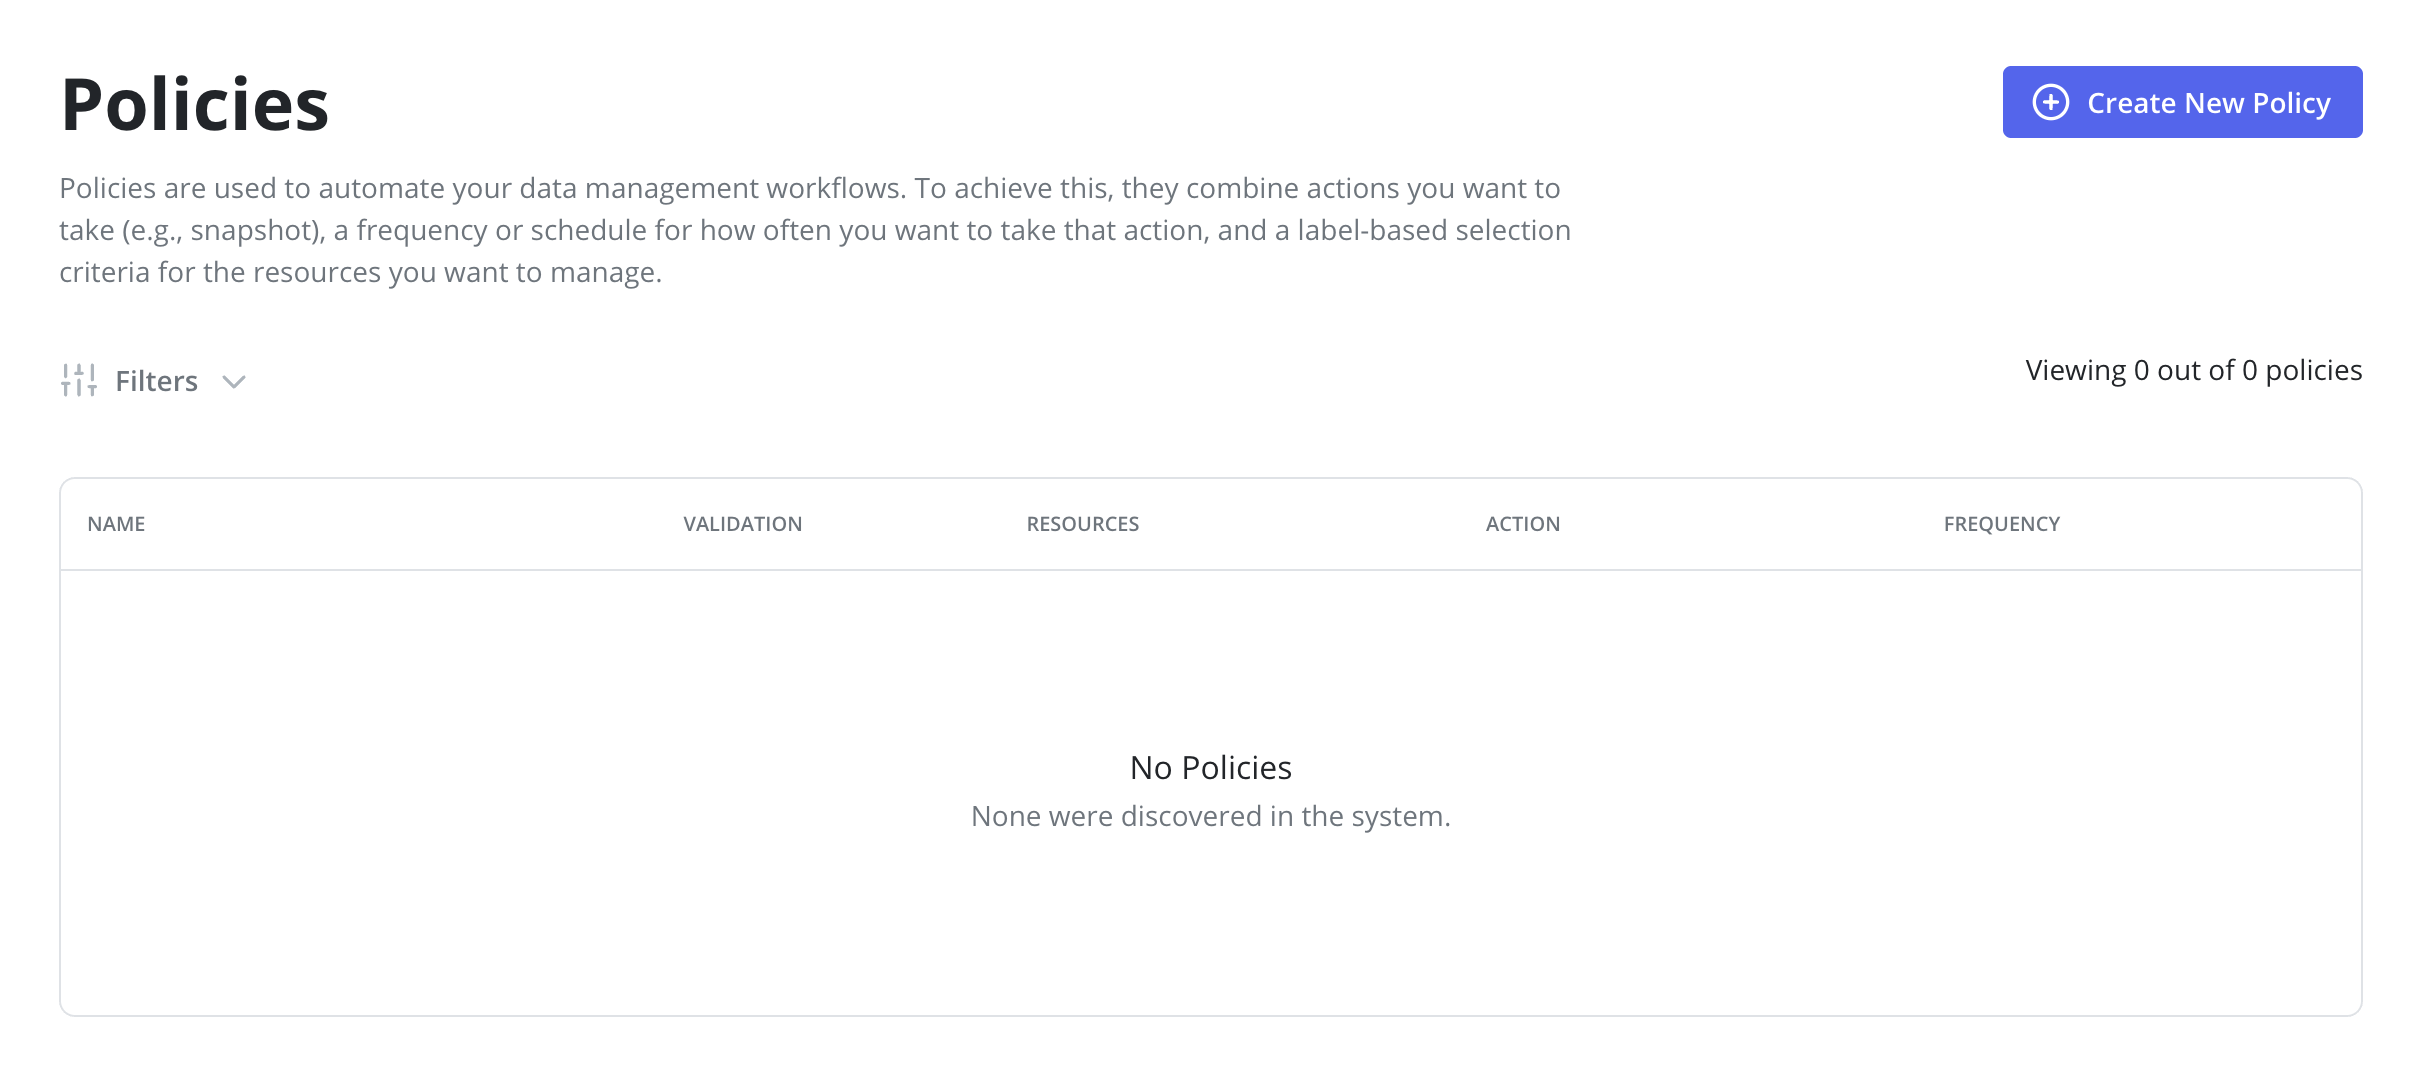
A policy can be created on the Policies page by clicking the Create New Policy button, or by navigating to the Applications page and selecting the menu option to Create a Policy for a specific application.
Settings
Accessible via the navigation sidebar, the Settings menu is where you
can access and configure:
- System Information (Logs download, upgrade status, etc.)
- Licenses (Veeam Kasten product licenses)
- Veeam Kasten Disaster Recovery
- Interface (Light/Dark Mode, Guided Tour)
Support
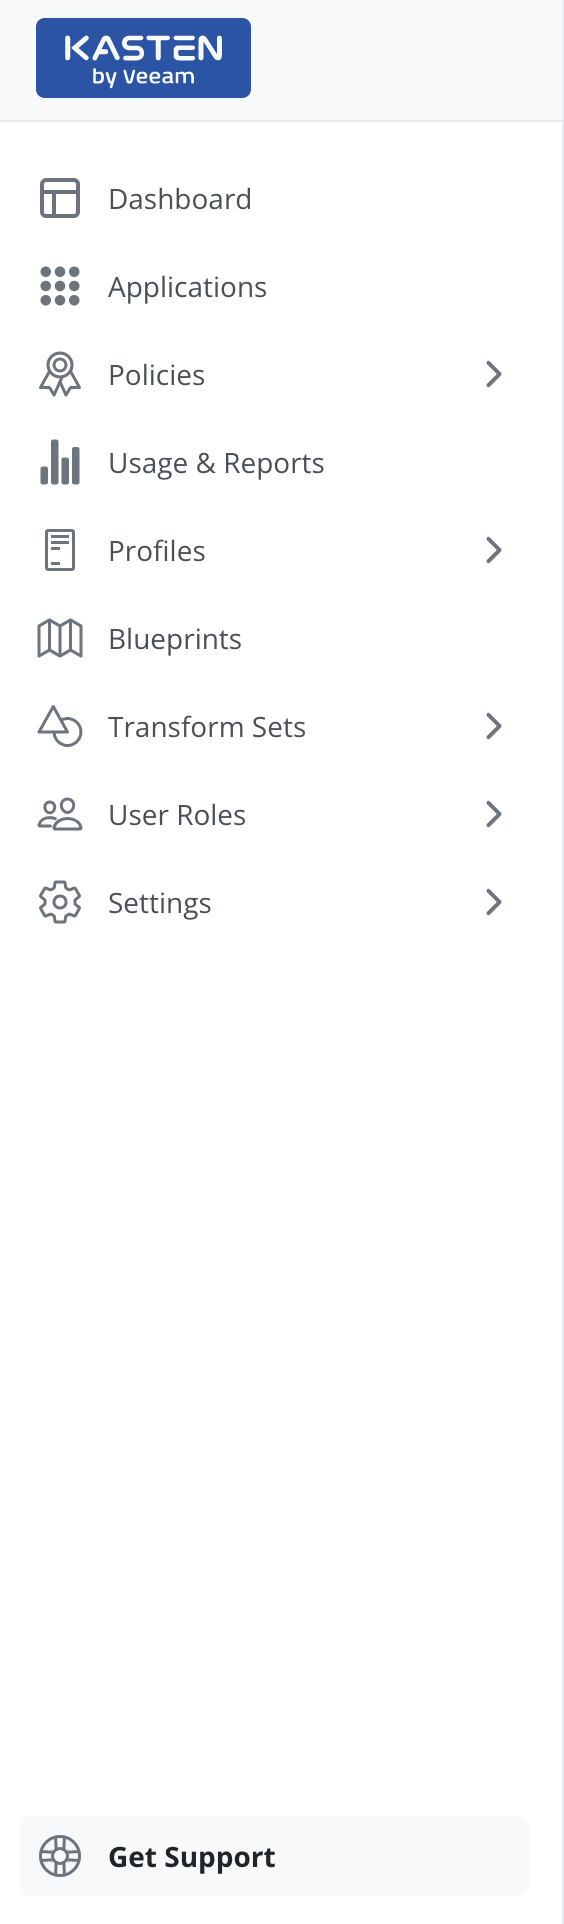
Located at the bottom of the navigation sidebar Get Support is where you can find links to open a Support case, this documentation, and the Knowledge Base articles.
Activity
Below the policy management section of the dashboard, you will find activity data. This consists of a graph that shows all activity in the system. As there are no default policies, you will not see any activity after the initial install but, once policies are defined, the graph will start displaying activity. Mousing over the graph will display action information such as status, action duration, action start time, and action completion time.
Some of the same activity information can also be viewed in tabular form under the graph. In particular, the dashboard first displays a summary of activity in the system including total actions, average action duration, number of data artifacts, the size of those artifacts, etc.
Following the activity and artifact summary, information on recent actions is displayed. This includes the Policy that generated the action which may include the number of child actions, the number of applications included in the Policy run, and start and completion times. The display for manual actions, such as manual snapshots, will be slightly different listing the phases and number of artifacts included in the action. You can also filter the displayed actions by the originating Policy, type of action, failed actions, and completed actions.
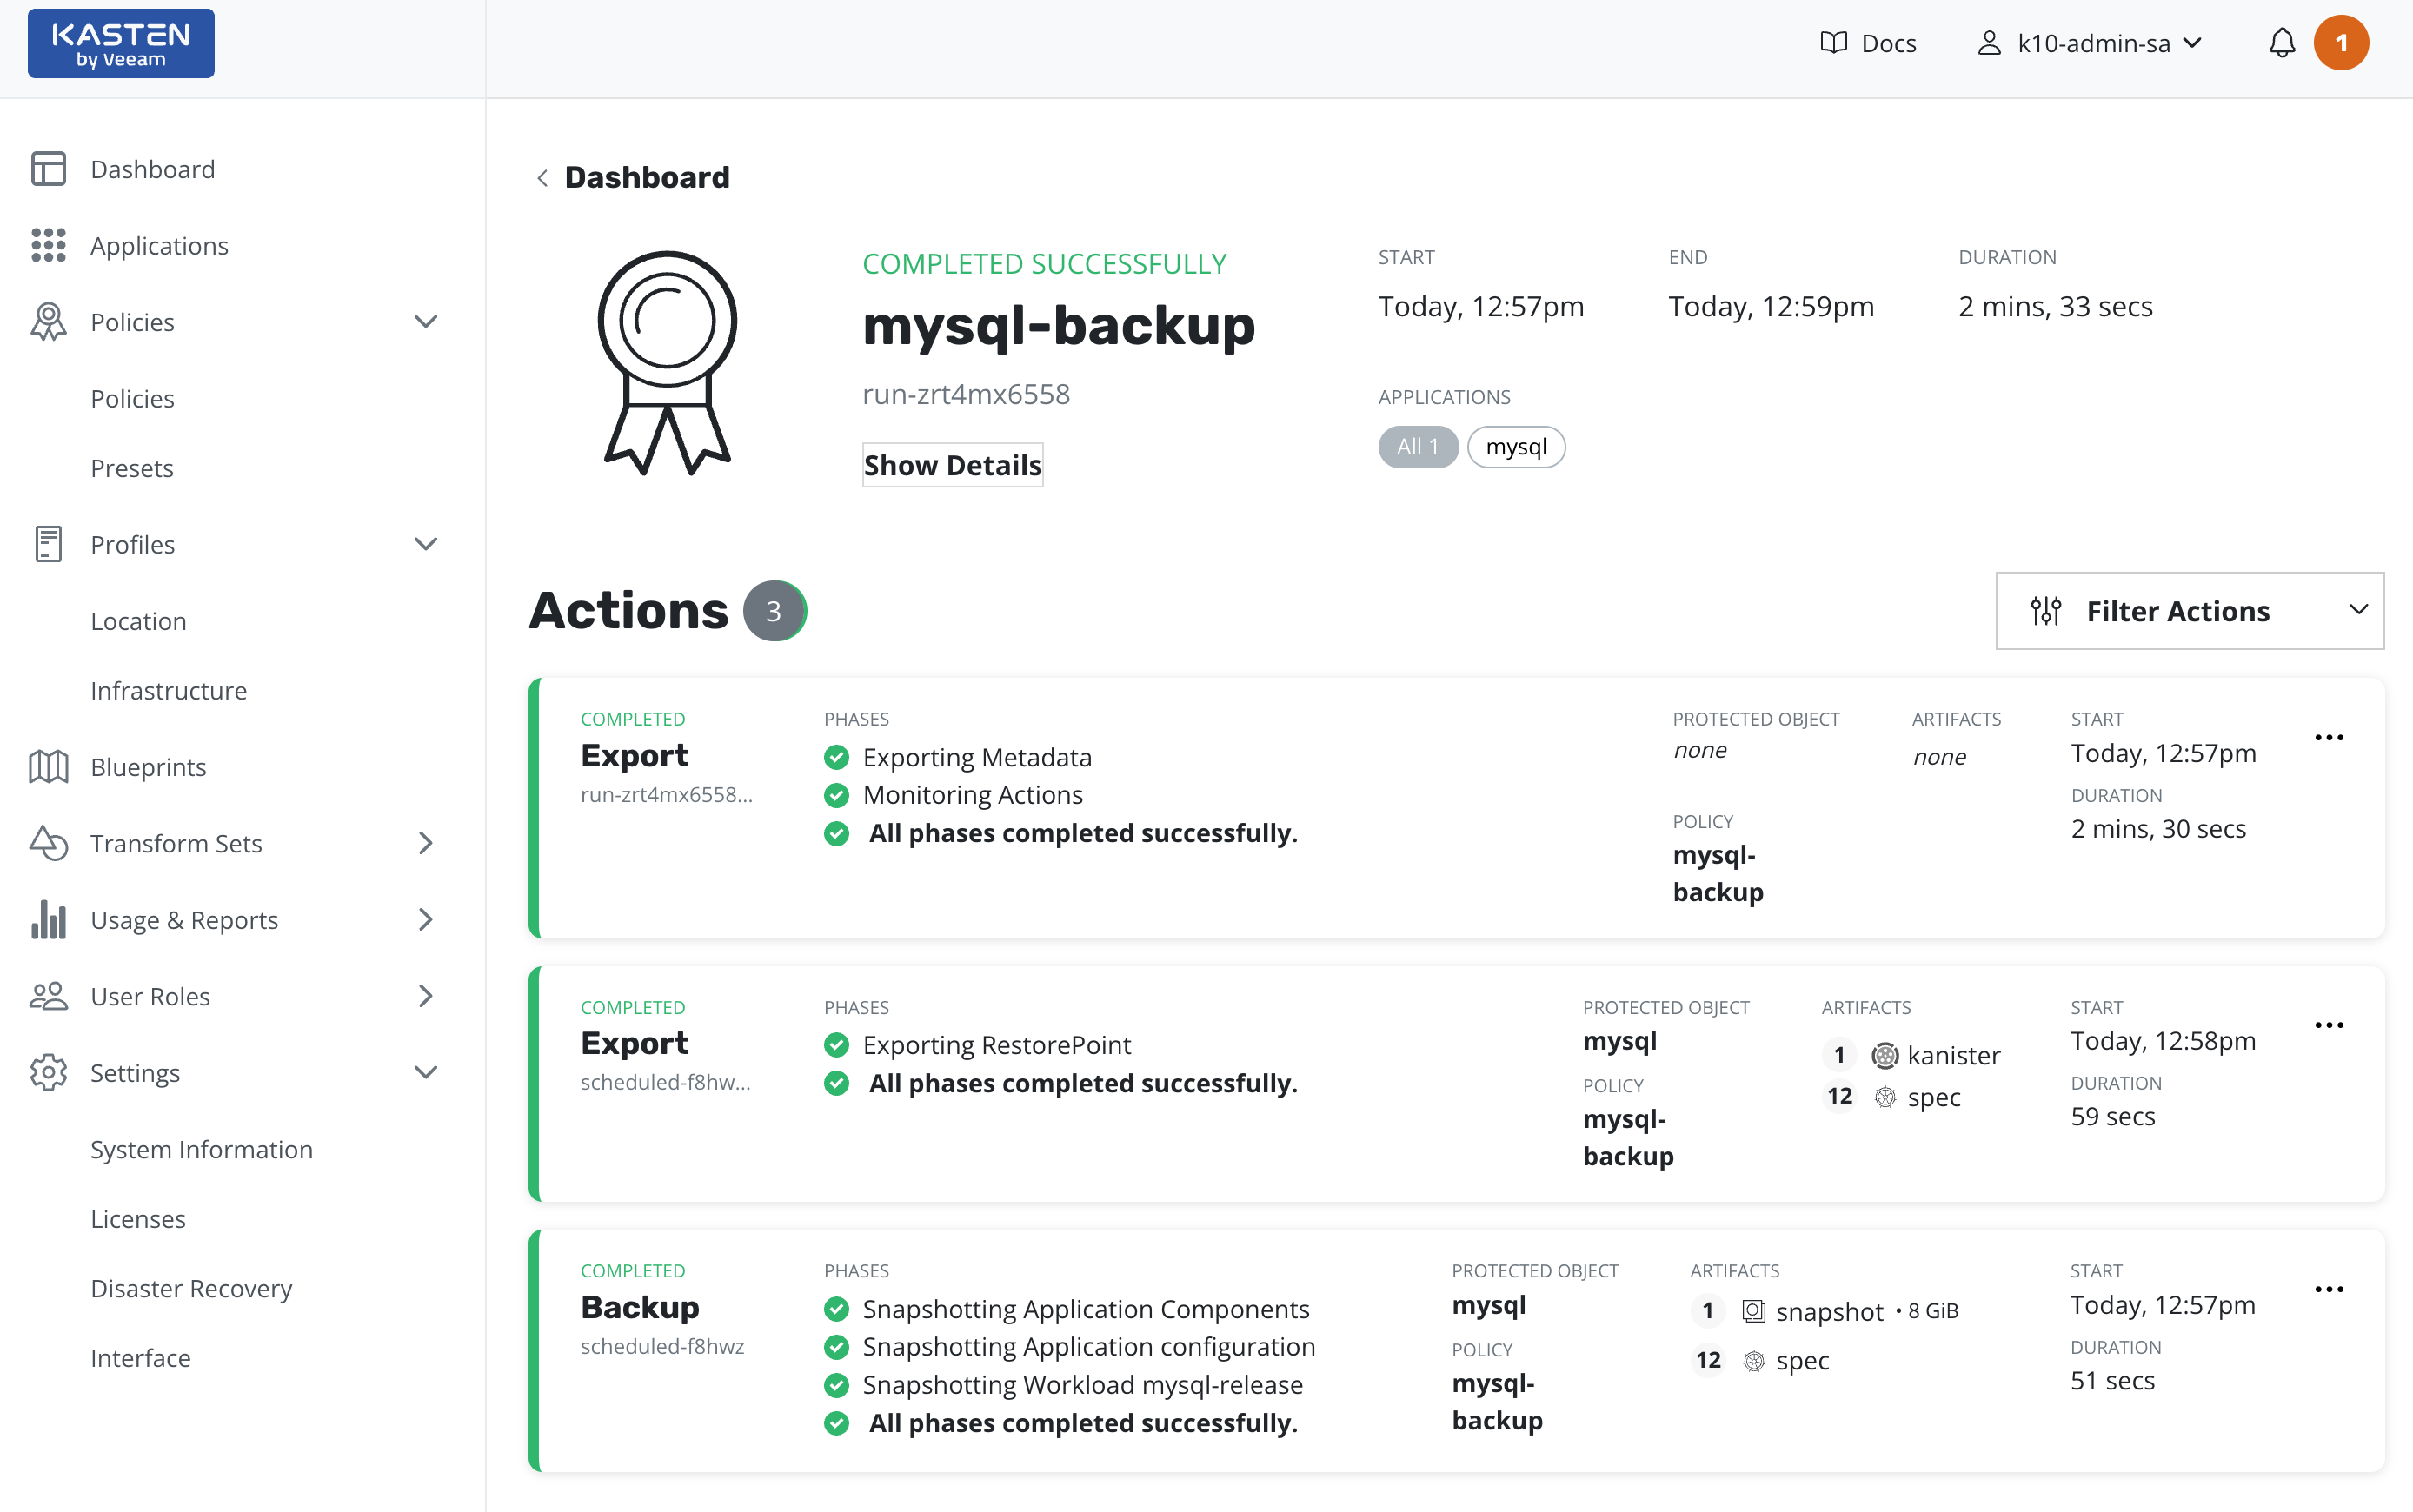
Actions listed as "Policy Run" can be expanded by clicking on the row, bringing up the policy run page for that action. This page states the number of actions included in the policy run along the the names of the applications.
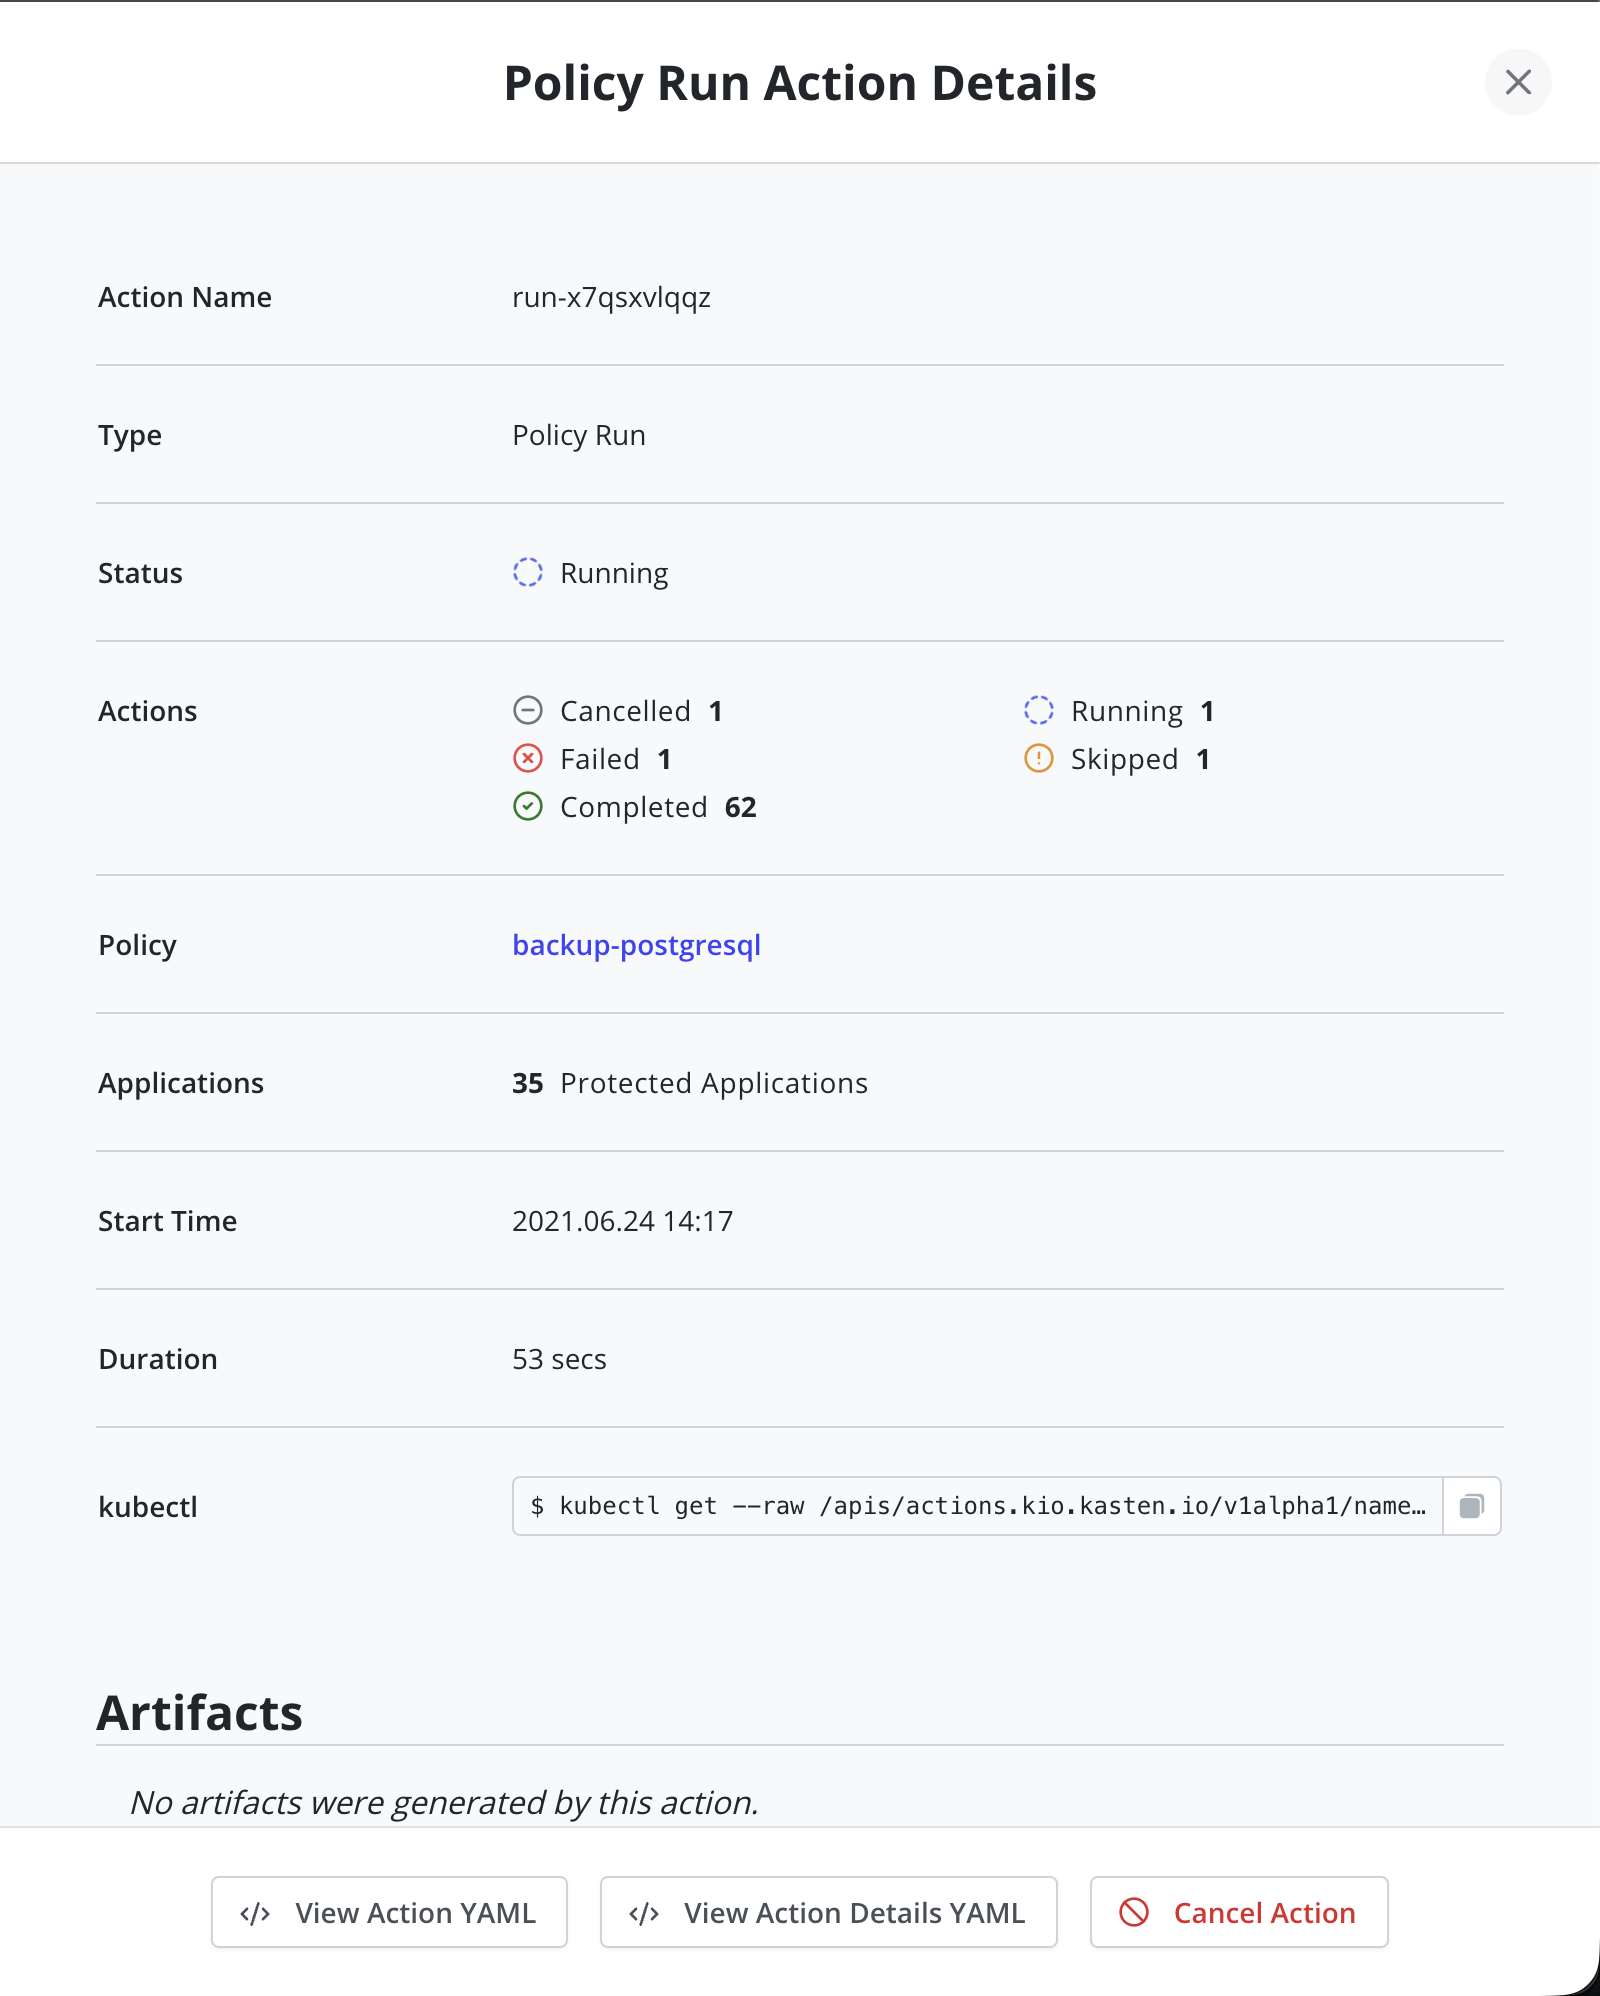
Actions in the running state can be cancelled. Click the running action in the actions list and look for the "Cancel Action" button on the action details panel. Cancellation is best-effort and may not take effect until the next cancellation checkpoint, typically between phases. See API Cancellation for more details.
Action States
Actions in Veeam Kasten progress through various states during their lifecycle:
- Pending: Action has been created but not yet started
- Running: Action has been validated and is currently executing
- AttemptFailed: At least one action phase needs to retry
- Failed: Action has failed (at least one phase failed permanently)
- Complete: Action has completed successfully or with exceptions
- Cancelled: Action was cancelled before completion
- Skipped: Action has been skipped
- Deleting: Action is being deleted
Manual Actions
Apart from policies, it is also possible to manually create a one-off application snapshot or export. From the Applications page, simply click on the quick action menu button.
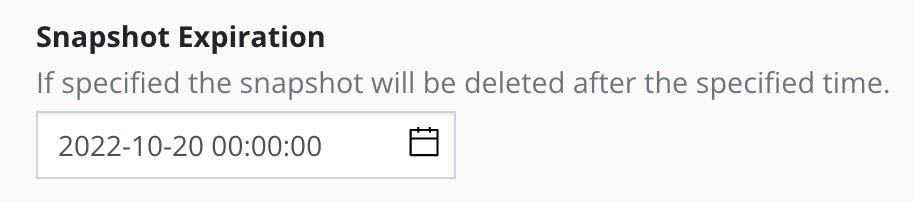
With manual snapshots it is possible to set an expiration date for the
snapshot. If this is not set then the snapshot will exist until it is
manually deleted from the underlying system. Via the
API this is done
by setting spec.expiresAt.