Overview
The K10 Multi-Cluster Manager dashboard has a number of different sections. A brief description of the sections is provided below.
Refer to K10 Multi-Cluster Manager page, to learn how to access the K10 Multi-Cluster Manager via dashboard and API.
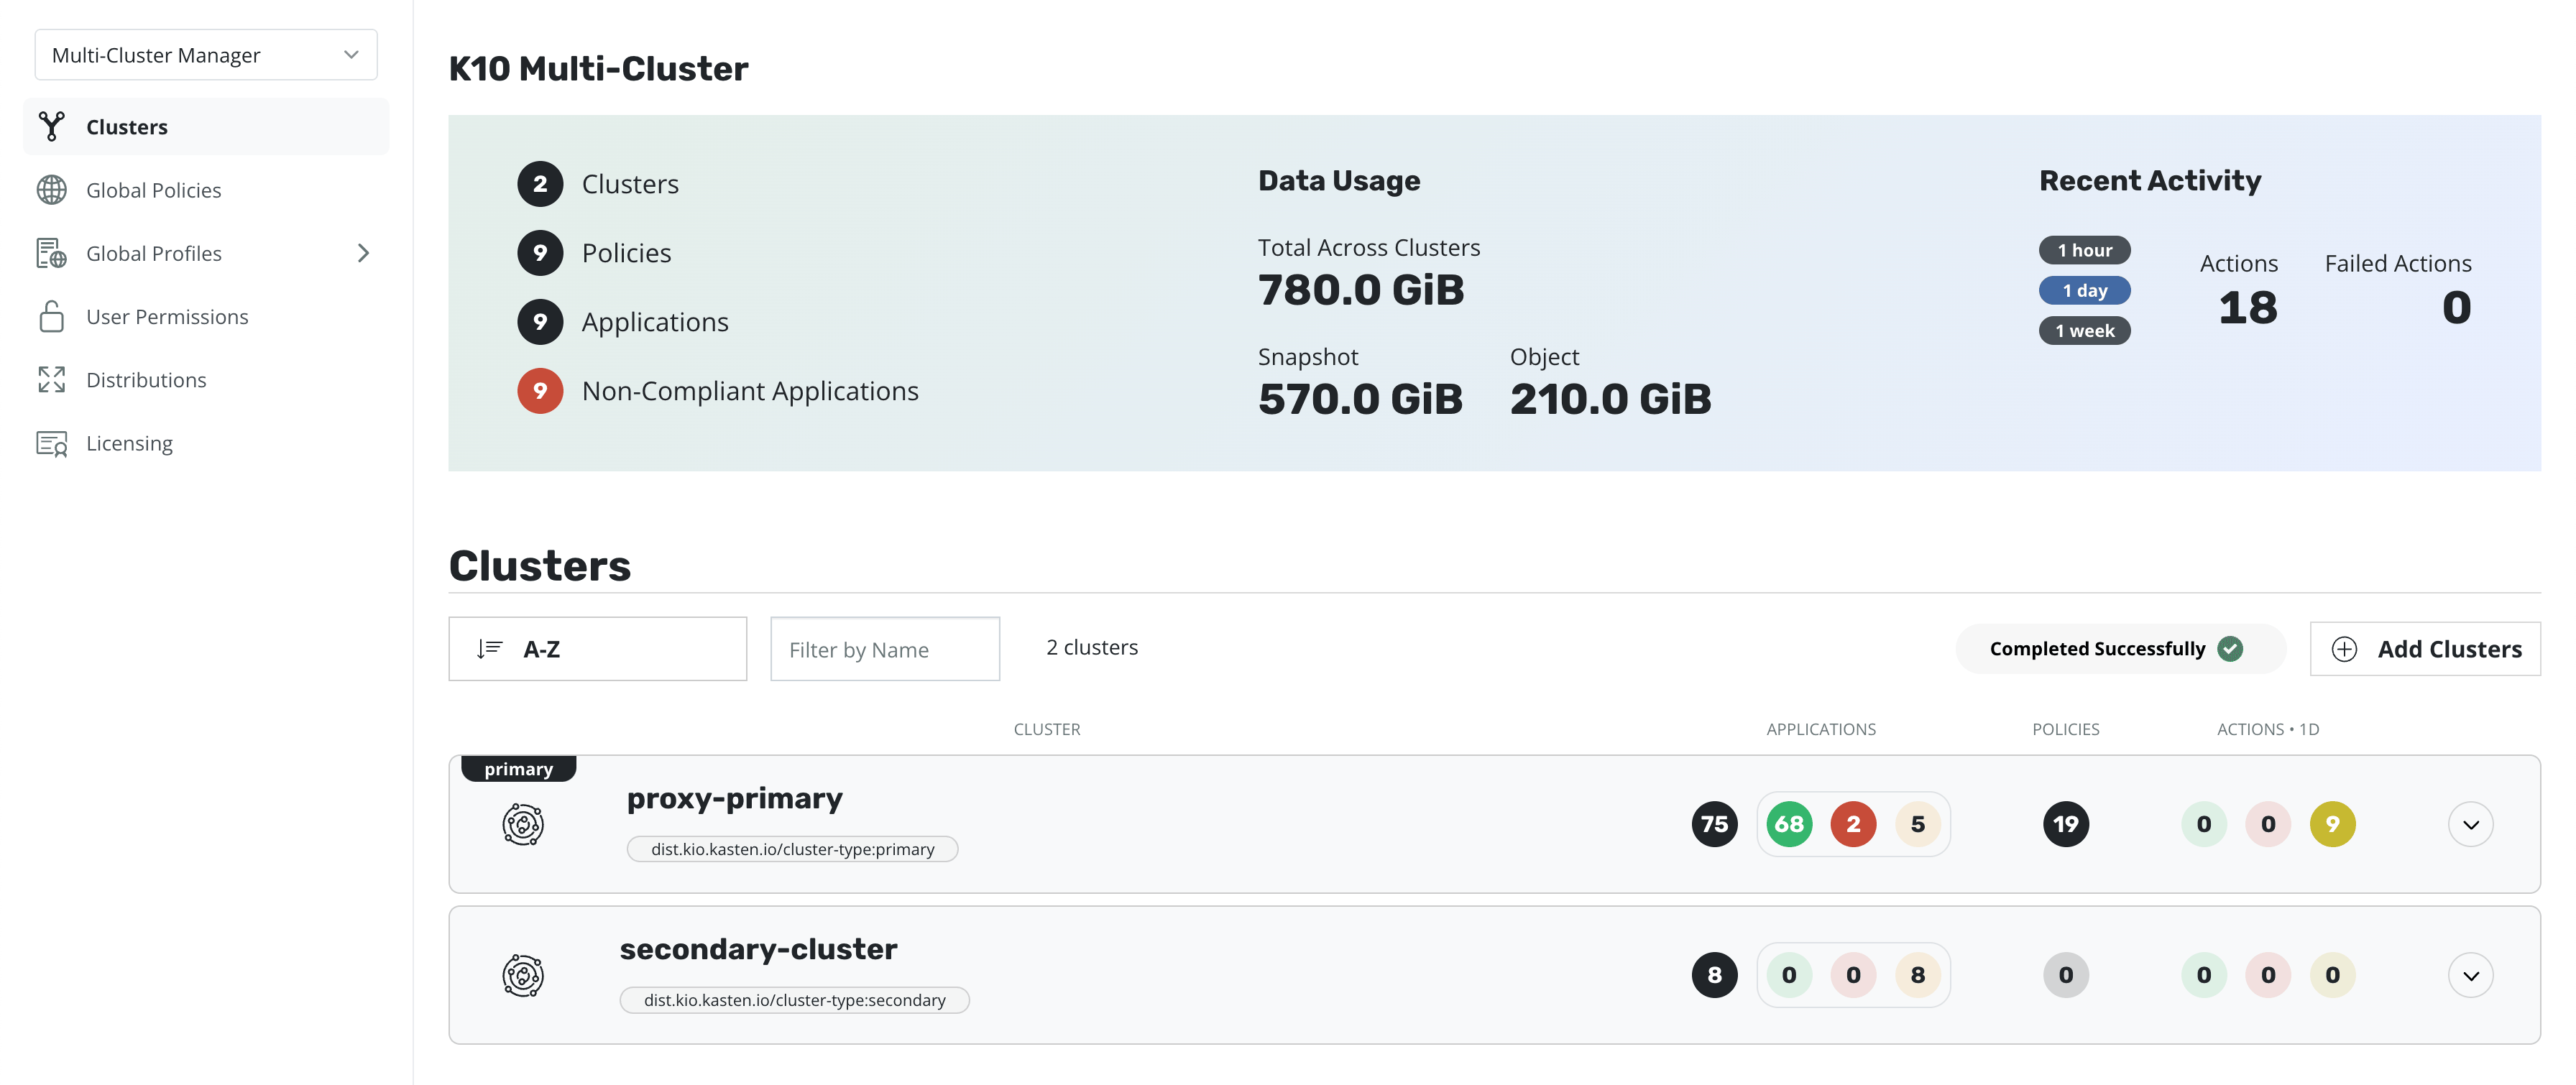
System Overview
The K10 Multi-Cluster Manager gives an overview of the entire multi-cluster system. All cluster information, application, global resource, data usage and recent activity across clusters can be inspected in a single pane of glass.
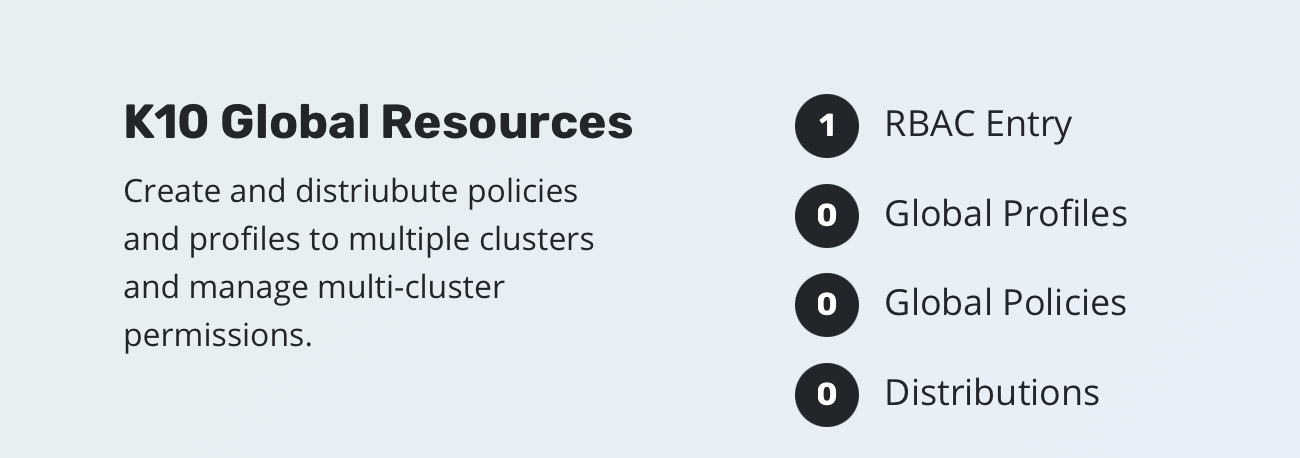
K10 Global Resources
With K10 Multi-Cluster Manager, profiles and policies can be defined at a global level and then distributed to individual or group of clusters. This allows for managing of resources in a single place without having to configure each resource separately on each individual cluster.
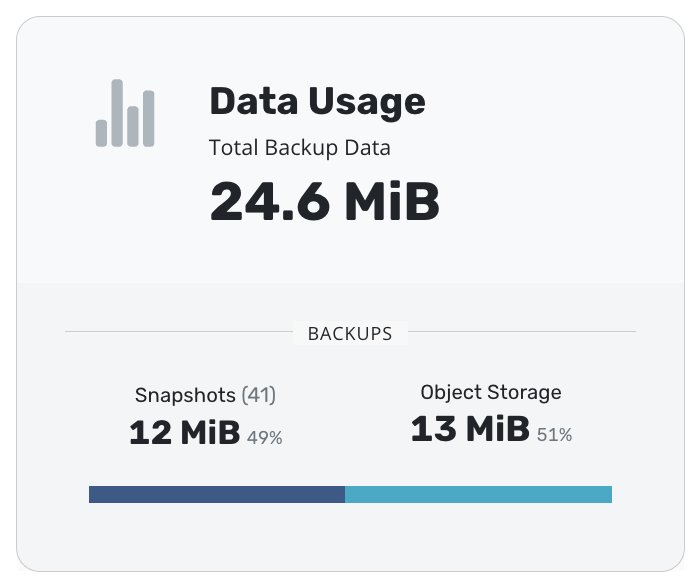
Data Usage
With K10 Multi-Cluster Manager, aggregated data usage across clusters can also be viewed in a single place.
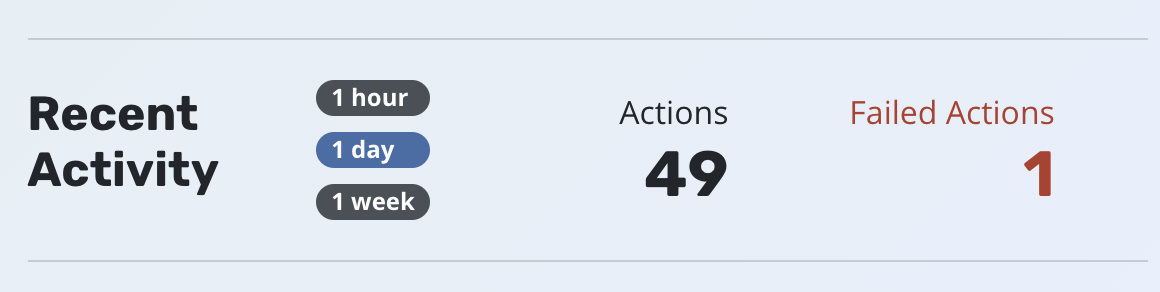
Recent Activity
The recent activity section, uses Prometheus metrics across all clusters, and gives an aggregated view of recent actions. The actions can be viewed over a week, day or an hour.
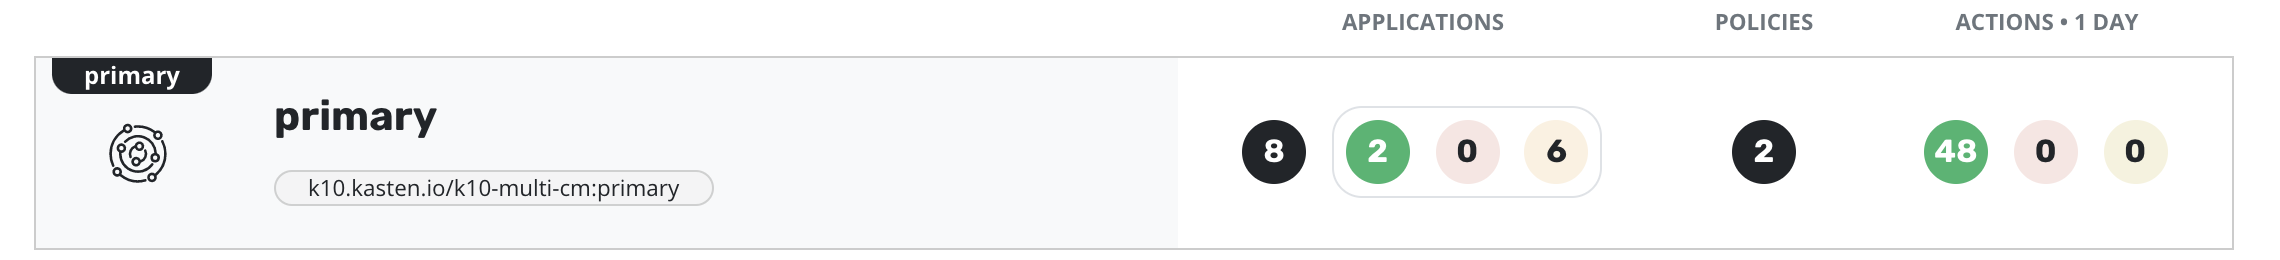
Clusters
K10 Multi-Cluster Manager allows for an aggregated view of all clusters configured in the system. Clusters can be filtered by name or labels. Each cluster displays application, policy and actions information. Each cluster can also be clicked through and explored individually.