Veeam Kasten for Kubernetes Overview
The Veeam Kasten data management platform, purpose-built for Kubernetes, provides enterprise operations teams an easy-to-use, scalable, and secure system for backup/restore, disaster recovery, and mobility of Kubernetes applications.
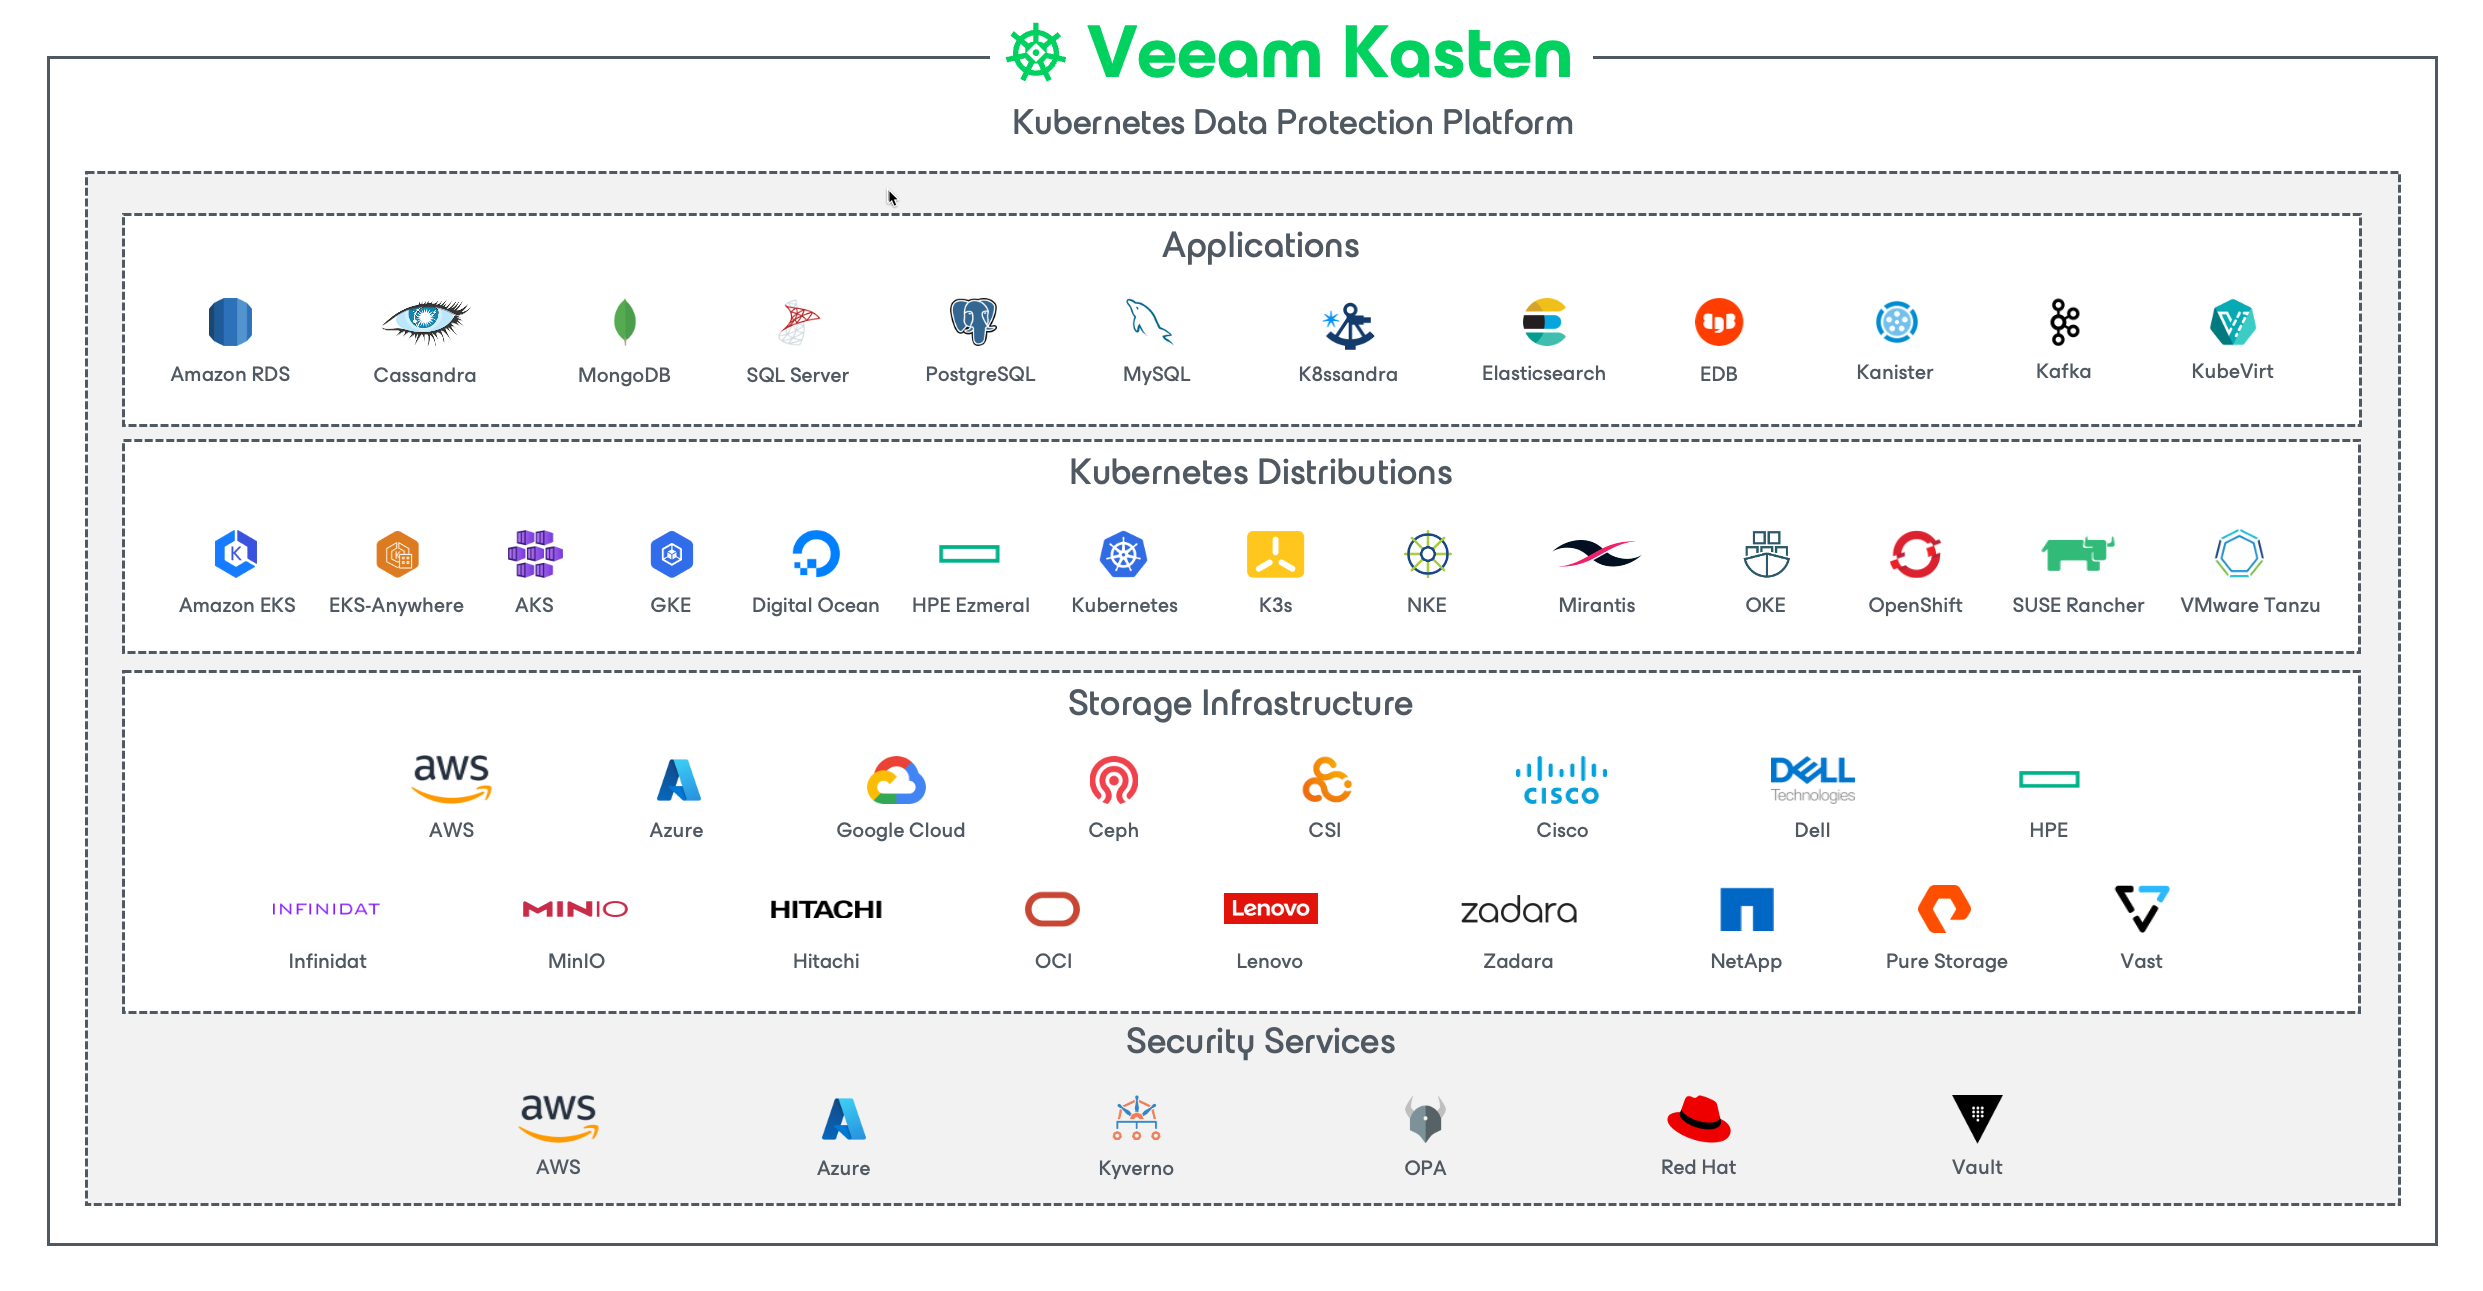
Veeam Kasten's application-centric approach and deep integrations with relational and NoSQL databases, Kubernetes distributions, and all clouds provide teams with the freedom of infrastructure choice without sacrificing operational simplicity. Policy-driven and extensible, Veeam Kasten provides a native Kubernetes API and includes features such as full-spectrum consistency, database integrations, automatic application discovery, multi-cloud mobility, and a powerful web-based user interface.
Given Veeam Kasten's extensive ecosystem support you have the flexibility to choose environments (public/ private/ hybrid cloud/ on-prem) and Kubernetes distributions (cloud vendor managed or self managed) in support of three principal use cases:
- Backup and Restore
- Disaster Recovery
- Application Mobility
Veeam Kasten Editions (Free and Enterprise)
Veeam Kasten is available in two editions. The default Starter edition, provided at no charge and intended for evaluation or for use in small non-production clusters, is functionally the same as the Enterprise edition but limited from a support and scale perspective. Customers choosing to upgrade to the Enterprise edition can obtain a license key from Kasten or install from cloud marketplaces. Please see the product page for a comparison of the editions.