Monitoring and Alerts
K10 enables centralized monitoring of all its activity by integrating with Prometheus. In particular, it exposes a Prometheus endpoint from which a central system can extract data. This section documents the install instructions to enable Prometheus usage, the metrics currently exposed, and how to generate alerts based on these metrics.
Using K10's Prometheus Endpoint
Exporting metrics from K10 is enabled by default. However, if you had
explicitly disabled it at install time, it can be re-enabled with a
helm upgrade (see more about upgrade at Upgrading K10)
command to modify an already existing installation. The upgrade option
to add is:
--set prometheus.enabled=true
Note
By default, Prometheus is configured with persistent storage size 8Gi and retention period of 30d. That can be changed with --set prometheus.server.persistentVolume.size=<size> and --set prometheus.server.retention=<days>. The complete list of configurable parameters can be found at Advanced Install Options.
Once Prometheus is enabled, metrics can be consumed from your Prometheus system by enabling the following scrape config:
- job_name: k10
  scrape_interval: 15s
  honor_labels: true
  scheme: http
  metrics_path: '/<k10-release-name>/prometheus/federate'
  params:
    'match[]':
      - '{__name__=~"jobs.*"}'
  static_configs:
    - targets:
      - 'prometheus-server.kasten-io.svc.cluster.local'
      labels:
        app: "k10"
K10 Metrics
While K10 exports a number of metrics, the jobs_duration metric is
the easiest one for monitoring job status because it is already
aggregated. This metric captures the running time of jobs that have
completed, whether they succeed or fail.
The jobs_duration metric is a Prometheus histogram, and thus it
comprises 3 "sub" metrics: jobs_duration_count, jobs_duration_sum and
jobs_duration_bucket. There is a single "status" label for the metric
which can take the following values: [succeeded, failed].
K10 also exposes catalog_actions_count metric which is labeled with
status , type, policy and namespace labels. Possible values
for status label are [complete, failed, running, pending] and
for type label, the possible values are
[backup, restore, import, export]. policy label value points
to the policy which initiates the action. namespace label value
is the application namespace involved in the action.
While extensive documentation on how to query metrics is available
elsewhere,
some of the queries that will be the most useful are
sum(jobs_duration_count) by (status) and
sum(jobs_duration_count{status="failed"}) by (status). The first
will, for a point query result, will generate two results, one for
succeeded and one for failed jobs. The second will produce one result
for the all the failed K10 jobs in the system.
Finally, if you are collecting metrics from distinct K10 instances running across different clusters, you can distinguish between metrics from different clusters by the use of labels.
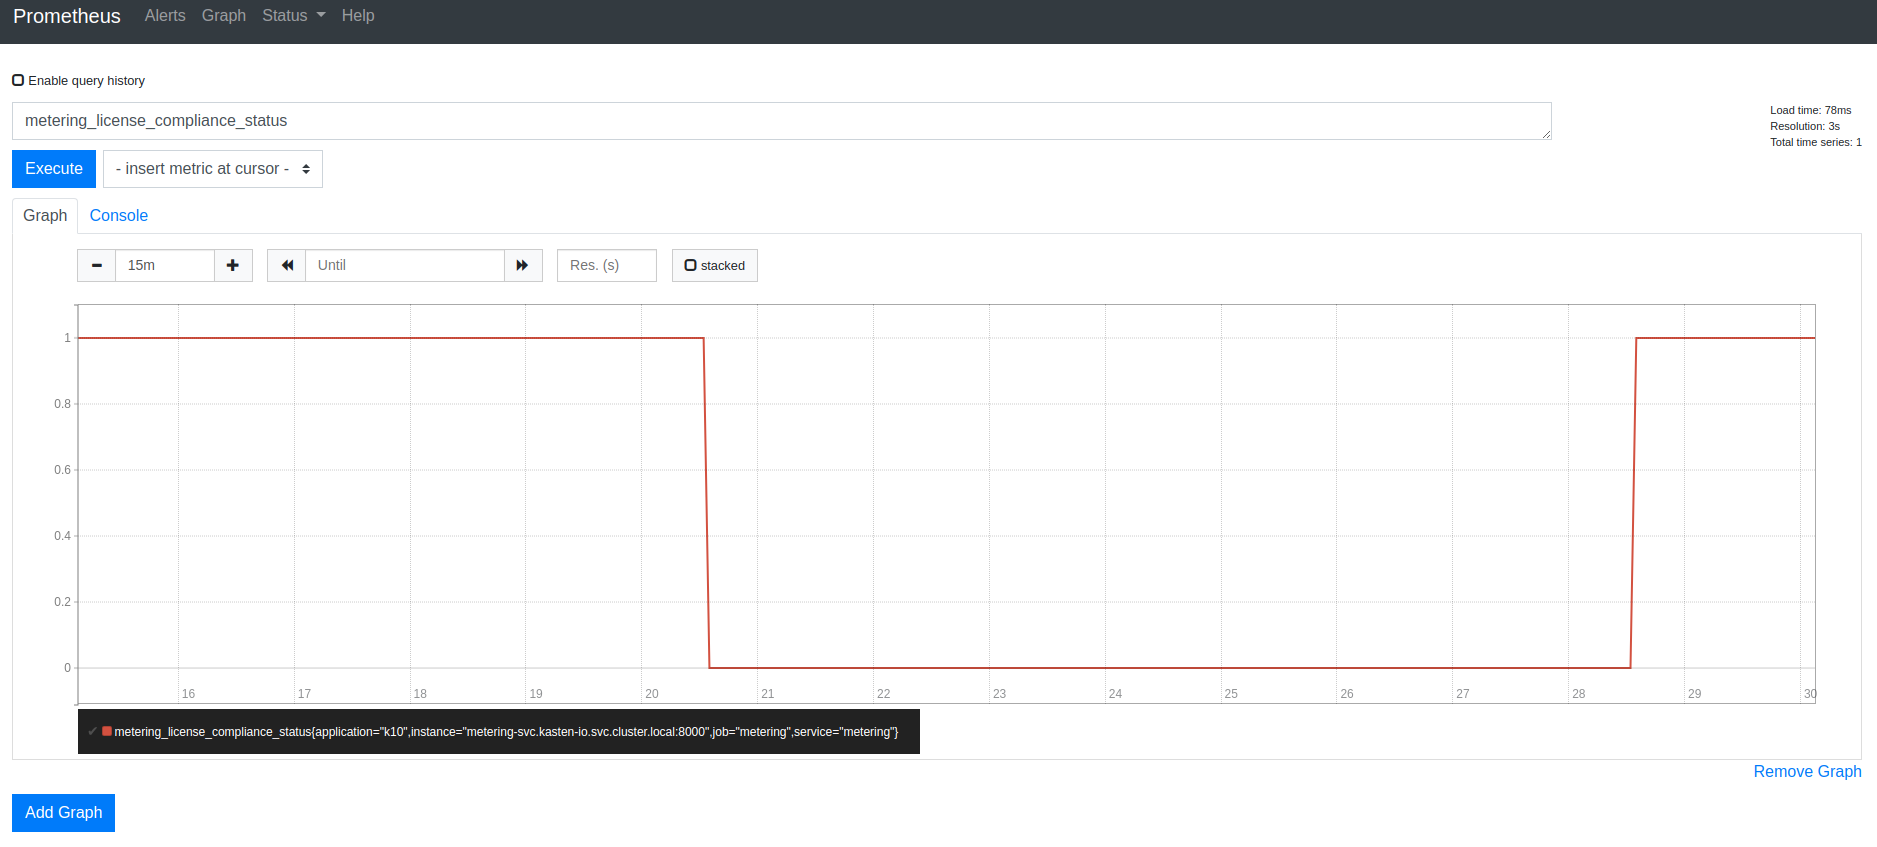
Cluster License Status
K10 exports the metering_license_compliance_status metric related
to cluster license compliance. This metric contains information on
when the cluster was out of license compliance.
The metering_license_compliance_status metric is a Prometheus gauge,
and has a value of 1 if the cluster's is license status is compliant and 0
otherwise. To see the timeline of when K10 was out of license compliance, the
metering_license_compliance_status metric can be queried and graphed.
Generating Alerts
Prometheus supports the creating of complex alerts based on gathered
metrics. To get you started, the following example will create an
alert if you have had any K10 jobs fail for the prod-daily policy
within the last 10 minutes.
- alert: JobsFailing
  expr: increase(catalog_actions_count{status="failed", policy="prod-daily"}[10m]) > 0
  for: 1m
  annotations:
    summary: "More than 1 failed K10 jobs for policy prod-daily for the last 10 min"
    description: "{{ $labels.app }} jobs amount of errors for the last 10 mins {{ $value }} for {{ $labels.policy }} policy"