Monitoring
K10 enables centralized monitoring of all its activity by integrating with Prometheus. In particular, it exposes a Prometheus endpoint from which a central system can extract data.
K10 can be installed with Grafana in the same namespace. This instance of Grafana is setup to automatically query metrics from K10's prometheus instance. It also comes with a pre created dashboard that helps visualize the status of K10's operations such as backup, restore, export and import of applications.
This section documents how to install and enable Grafana and Prometheus, usage of the metrics currently exposed, generation of alerts and reports based on these metrics, and integration with external tools.
Using K10's Prometheus Endpoint
By default, Prometheus is configured with persistent storage size 8Gi and
retention period of 30d. That can be changed with --set
prometheus.server.persistentVolume.size=<size> and --set
prometheus.server.retention=<days>. The complete list of configurable
parameters can be found at Advanced Install Options.
An external Prometheus server can be configured to scrape K10's built-in server. The following scrape config is an example of how a Prometheus server hosted in the same cluster might be configured:
- job_name: k10
  scrape_interval: 15s
  honor_labels: true
  scheme: http
  metrics_path: '/<k10-release-name>/prometheus/federate'
  params:
    'match[]':
      - '{__name__=~"jobs.*"}'
  static_configs:
    - targets:
      - 'prometheus-server.kasten-io.svc.cluster.local'
      labels:
        app: "k10"
Note
An additional NetworkPolicy may need to be applied in certain environments.
Although it's possible to disable K10's built-in Prometheus server enabled,
it's recommended to leave it enabled. Disabling the server reduces
functionality in various parts of the system such as usage data, reporting, and
the multi-cluster dashboard. To disable the built-in server, set the
prometheus.server.enabled value to false.
If the built-in server has previously been disabled, it can be re-enabled
during a helm upgrade (see Upgrading K10) with: --set
prometheus.server.enabled=true.
K10 Metrics
While K10 exports a number of metrics, the jobs_duration metric is
the easiest one for monitoring job status because it is already
aggregated. This metric captures the running time of jobs that have
completed, whether they succeed or fail.
The jobs_duration metric is a Prometheus histogram, and thus it
comprises 3 "sub" metrics: jobs_duration_count, jobs_duration_sum and
jobs_duration_bucket. There is a single "status" label for the metric
which can take the following values: [succeeded, failed].
K10 Compliance Metrics
To track the number of applications outside of compliance,
the metric compliance_count is available with the
following states of interest: [NotCompliant, Unmanaged].
K10 Status Metrics
The state of profiles and policies can be monitored with profiles_count
and policies_count respectively.
profiles_count{type="Location", status="Failed"} reporting a value greater
than 0 would be grounds for further investigation as it would create issues
for any related policies. type="Infra" is also available for Infrastructure
profiles.
policies_count{action="backup", chained="export", status="Failed"} reports
on policies involving both a backup and export that are in a failed state.
K10 Action Metrics
As K10 performs various actions throughout the system, metrics are collected about those actions. Counts for both cluster and application-specific actions are collected.
These action metrics include labels describing the context of the action. For
actions specific to an application, the application name is included as
app. For actions initiated by a policy, the policy name is included as
policy. For ended actions, the final status is included as state
(i.e. succeeded, failed, or cancelled).
Tip
When using K10 Multi-Cluster Manager, a cluster label must
also be included. The cluster label should match the name of a
secondary cluster or be blank ("") to query metrics for the primary
cluster.
Separate metrics are collected for the number of times the action was started,
ended, or skipped. This is indicated by the suffix of the metric
(i.e. _started_count, _ended_count, or _skipped_count).
An overall set of metrics is also collected that does not include the app
or policy labels. These metrics end with _overall rather than
_count. The overall metrics should be preferred unless application or
policy specific information is required.
Metrics are collected for the following actions:
backupandbackup_clusterrestoreandrestore_clusterexportimportreportrun
For example, to query the number of successful backups in the past 24 hours:
sum(round(increase(action_backup_ended_overall{state="succeeded"}[24h])))
Or to query the number of failed restores for the past hour:
sum(round(increase(action_restore_ended_overall{state="failed"}[1h])))
Important
Due to action metrics being reported as counters, the
increase or rate functions must be used when querying. See
Prometheus query functions for
more information.
Additional documentation on querying data from Prometheus can be found in the Prometheus docs.
K10 Storage Metrics
To check exported storage consumption (Object, NFS or Veeam
Backup & Replication) there is export_storage_size_bytes with types
[logical, physical],
e.g. export_storage_size_bytes{type="logical"}.
The deduplication ratio is calculated by logical / physical.
snapshot_storage_size_bytes, also with logical and physical types,
reports the local backup space utilization.
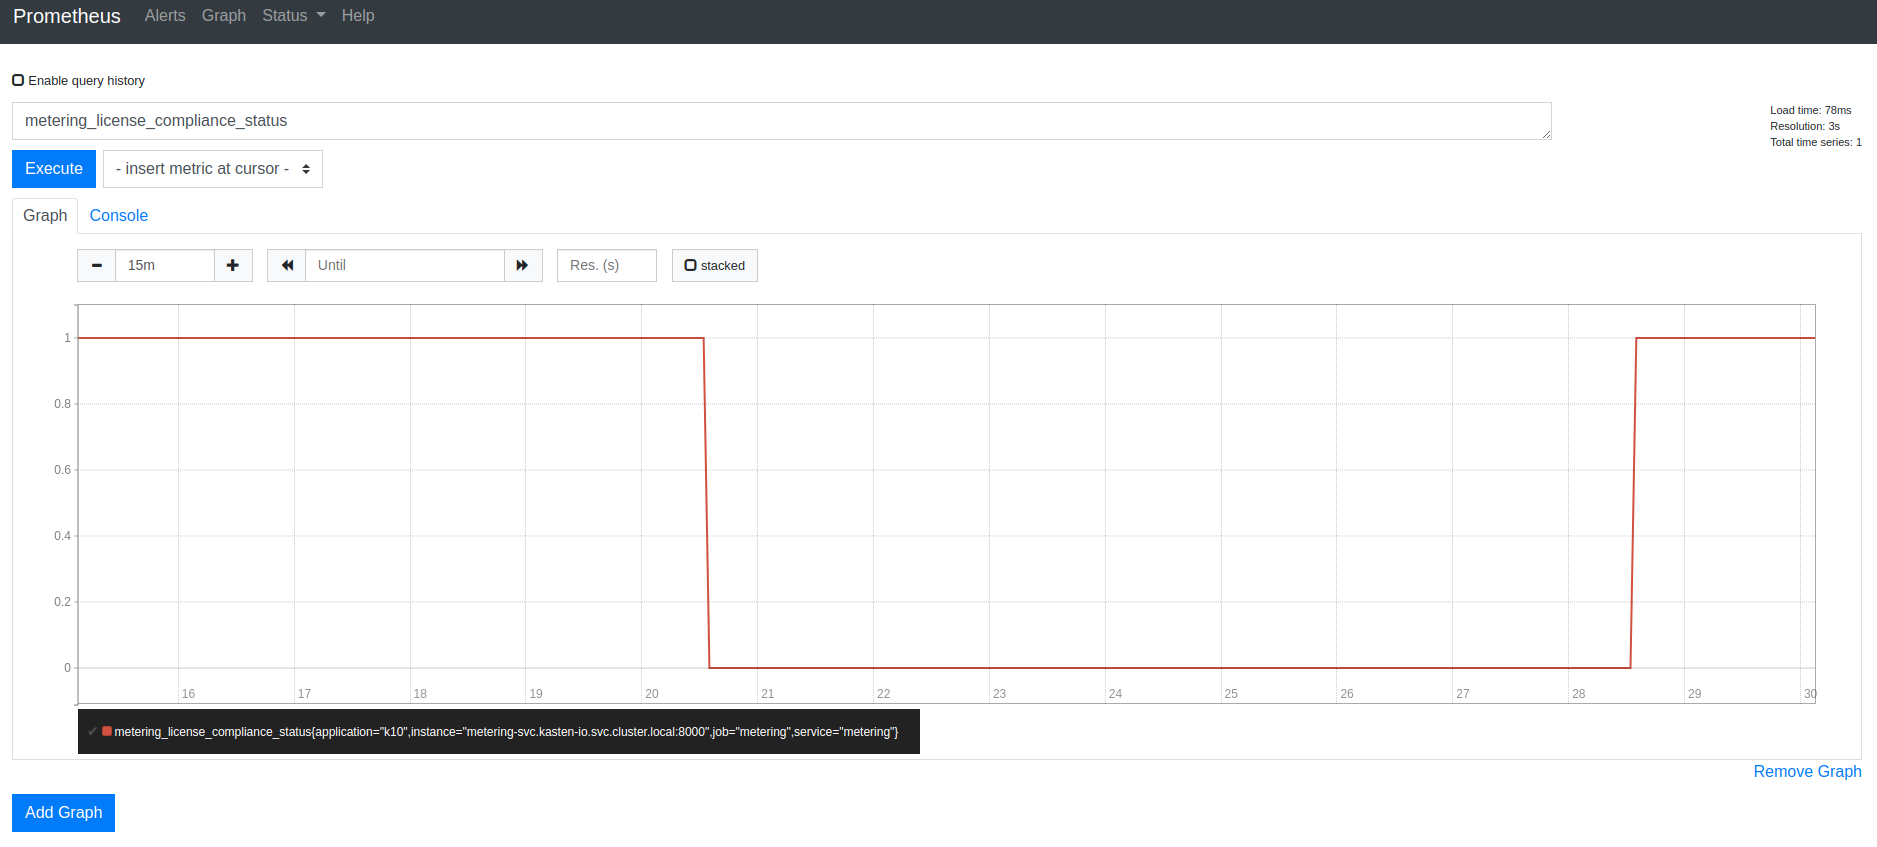
Cluster License Status
K10 exports the metering_license_compliance_status metric related
to cluster license compliance. This metric contains information on
when the cluster was out of license compliance.
The metering_license_compliance_status metric is a Prometheus gauge,
and has a value of 1 if the cluster's is license status is compliant and 0
otherwise. To see the timeline of when K10 was out of license compliance, the
metering_license_compliance_status metric can be queried and graphed.
It is possible to see the peak node usage for the
last two months e.g. by querying node_usage_history{timePeriod="202210"}.
The label format is YYYYMM.
Using K10's Grafana Endpoint
Installation
To enable/disable Grafana and Prometheus, use this helm value while installing/upgrading K10. The helm value is enabled by default.
--set grafana.enabled=true
Accessing Grafana from K10's dashboard
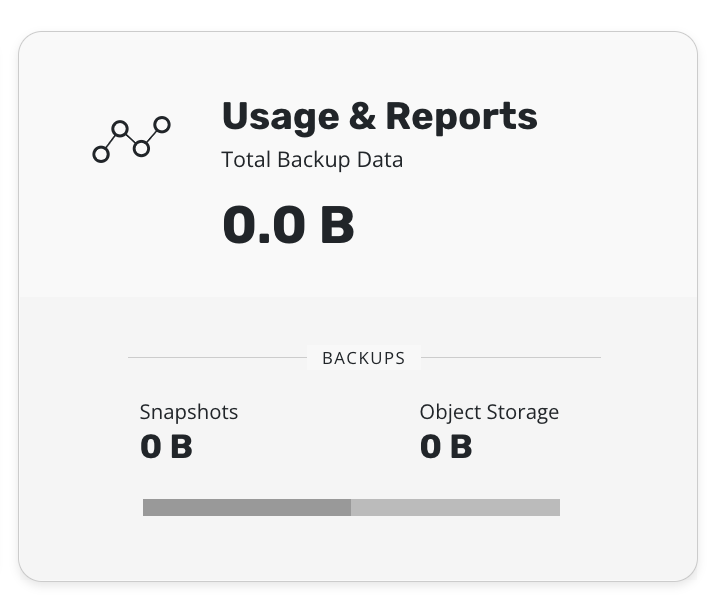
Click on the "Usage and Reports" card on K10's dashboard.
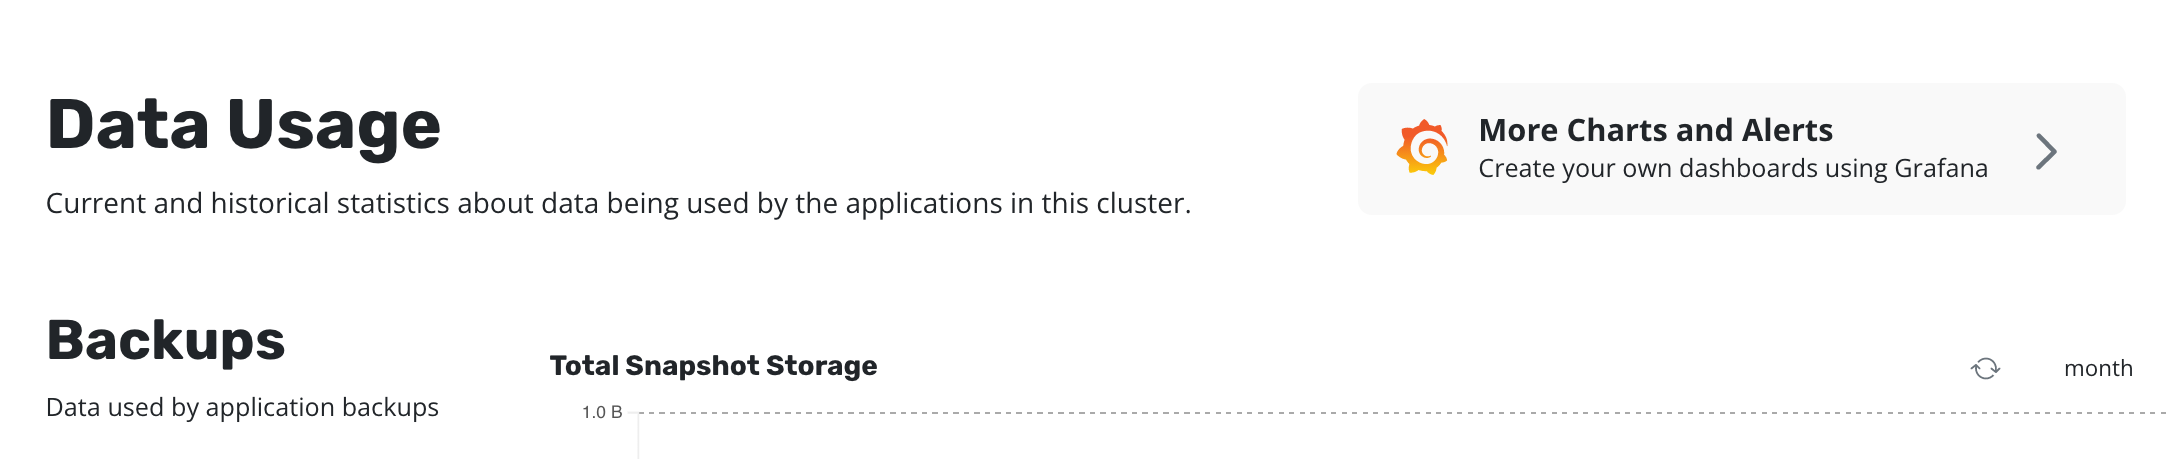
Click on "More Charts and Alerts" to access the instance of Grafana installed with K10.
Charts and Graphs
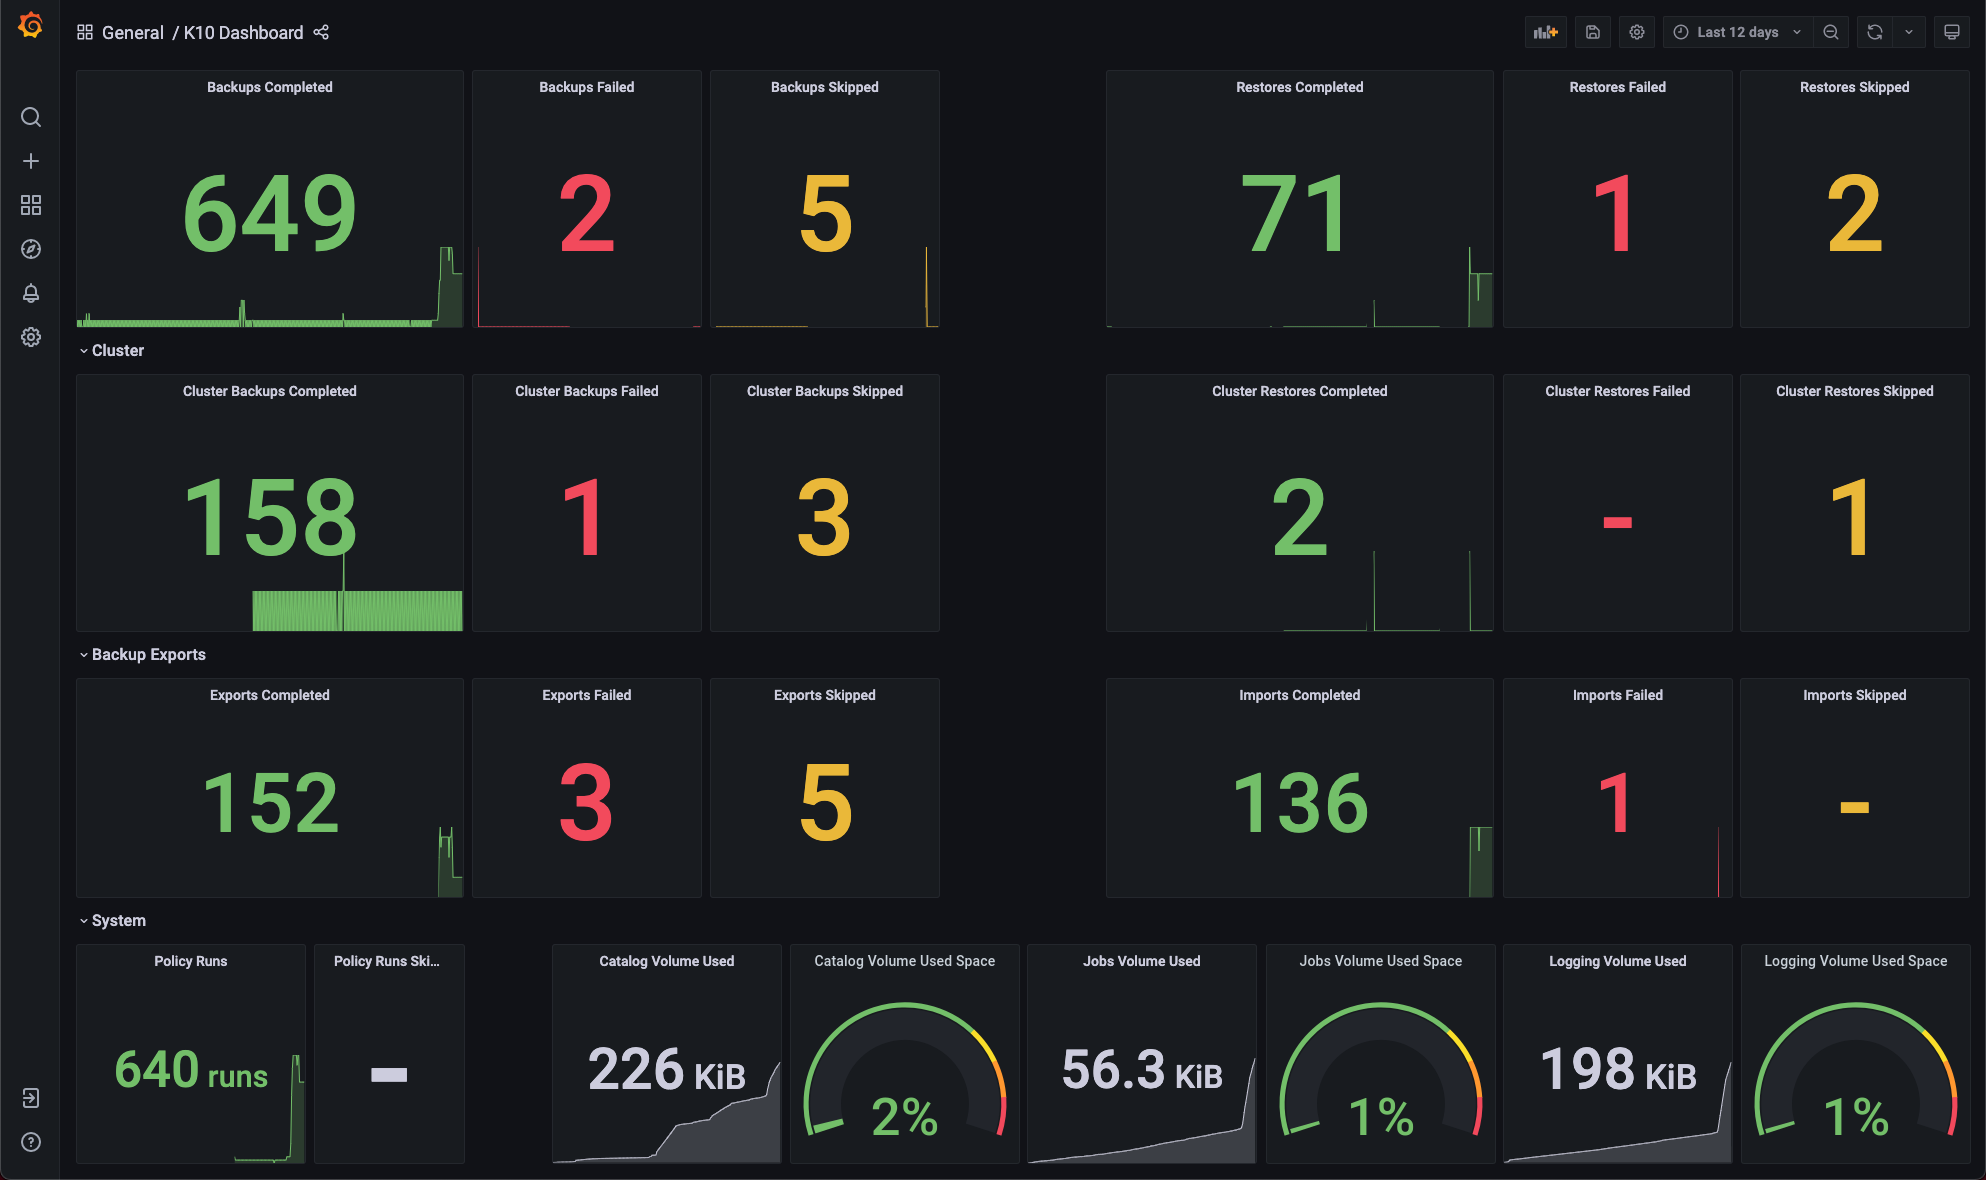
The Grafana dashboard can be used to monitor how many application scoped or cluster scoped actions (backup, restore, export and import) have completed, failed or been skipped.
It shows the number of policy runs that have completed or been skipped.
The amount of disk space consumed and the percentage of free space available in K10's stateful services (catalog, jobs, and logging) are also shown.
Grafana Alerts
Grafana can be used to create alerts to get notified moments after something unexpected happens in your system. An alert can be generated by specifying a condition or evaluation criteria and, these conditions can be configured using Alert rules. Each rule uses a query that fetches data from a data source. Each query involves a metric such as the K10 metrics described in a previous section. More can be read about this by following the Grafana Alerting documentation.
There are three main constructs that are involved while creating alerts in Grafana:
Alert rules
The condition on which the alerts should be fired can be configured using alert rules.
A new alert rule can be created by going to the dashboard's edit option and
then clicking on the Alert tab at the bottom of the page. In this
example, it's assumed that a dashboard panel named Dashboard Local
is already created.
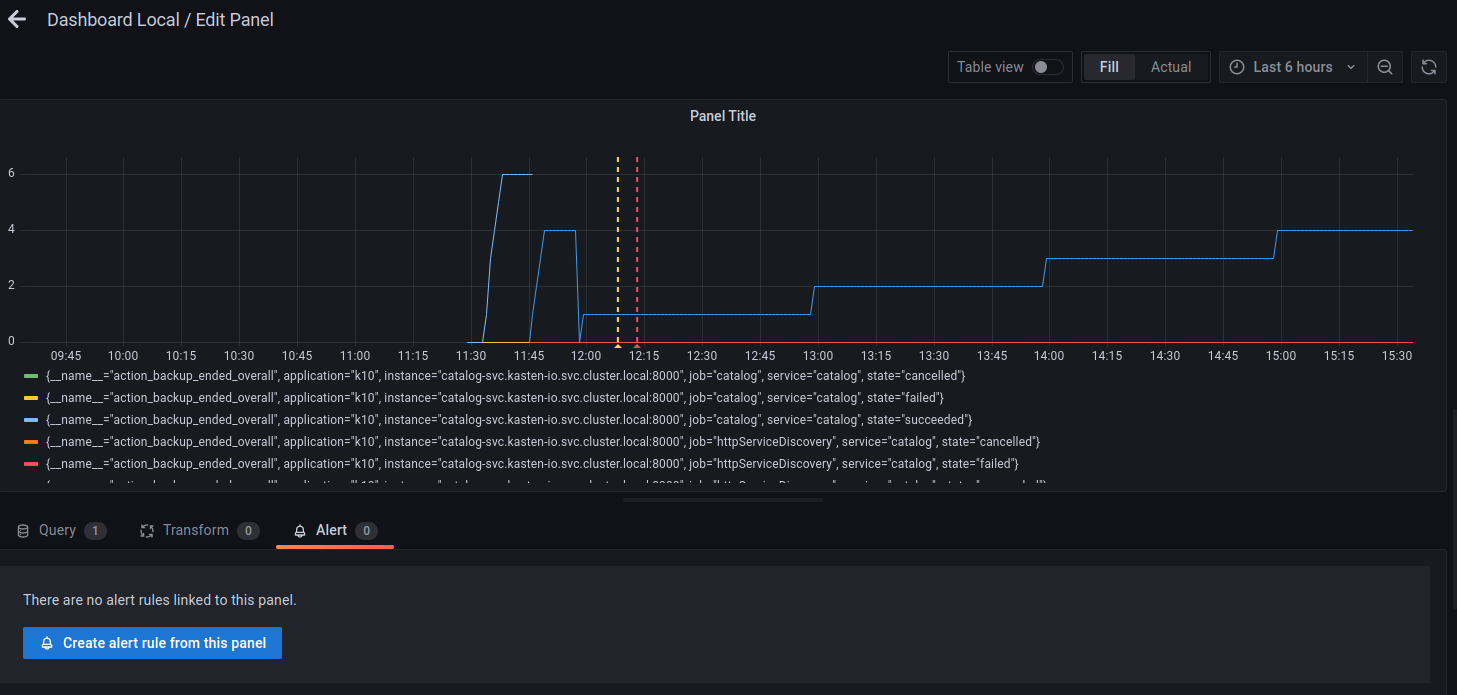
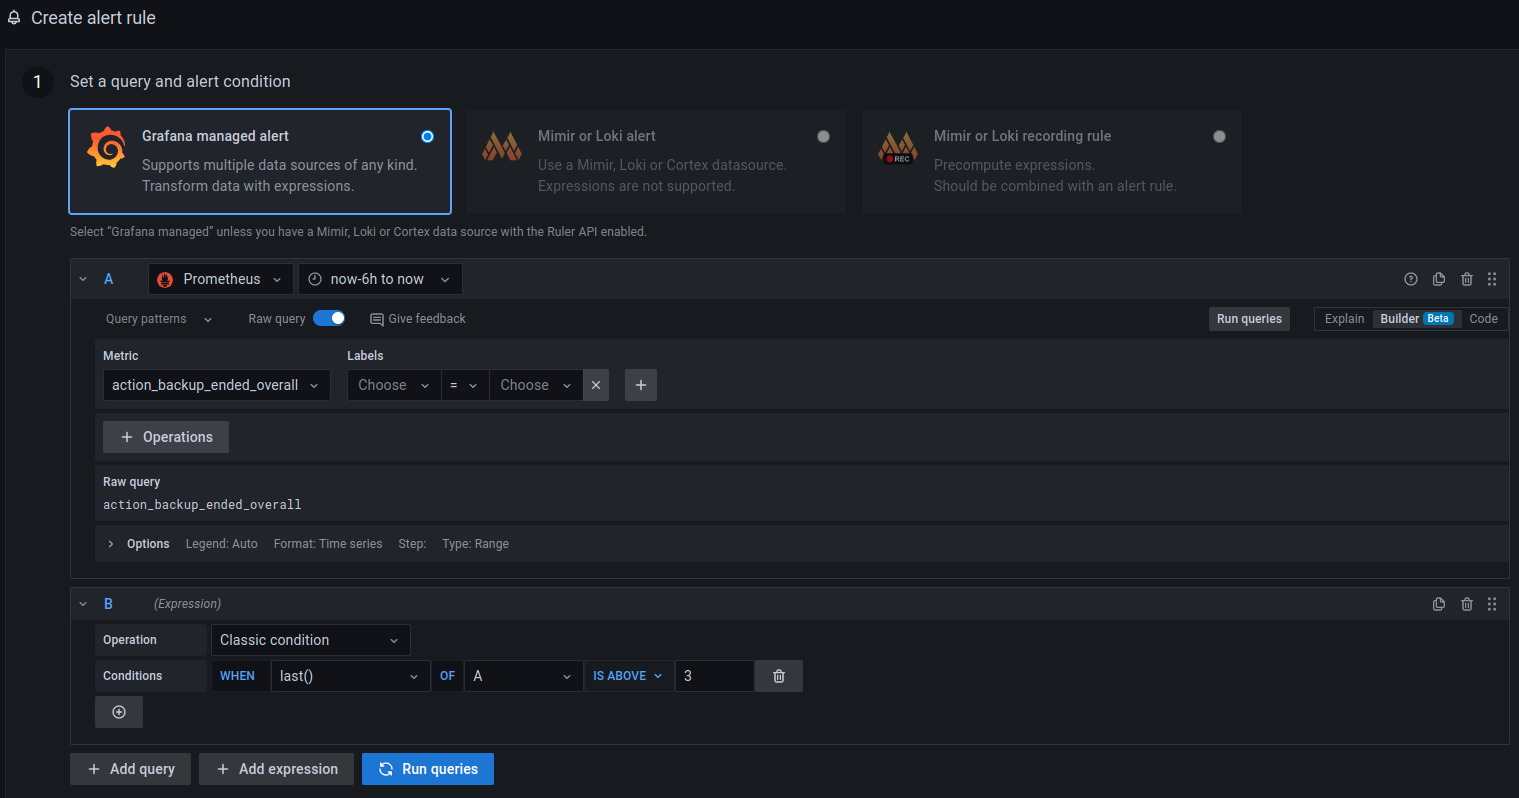
Once there, the Create alert rule from this panel button can be used
to set the query and alert condition for this alert rule. Configure the
datasource that should be used in this alert and the metric that should
be queried.
In this example, datasource Prometheus and metric
action_backup_ended_overall were used.
After setting the query and alert condition, the label of this alert
rule can be configured by scrolling down the same page, until Notifications
options.
Labels are useful to configure where these alerts are going to be sent.
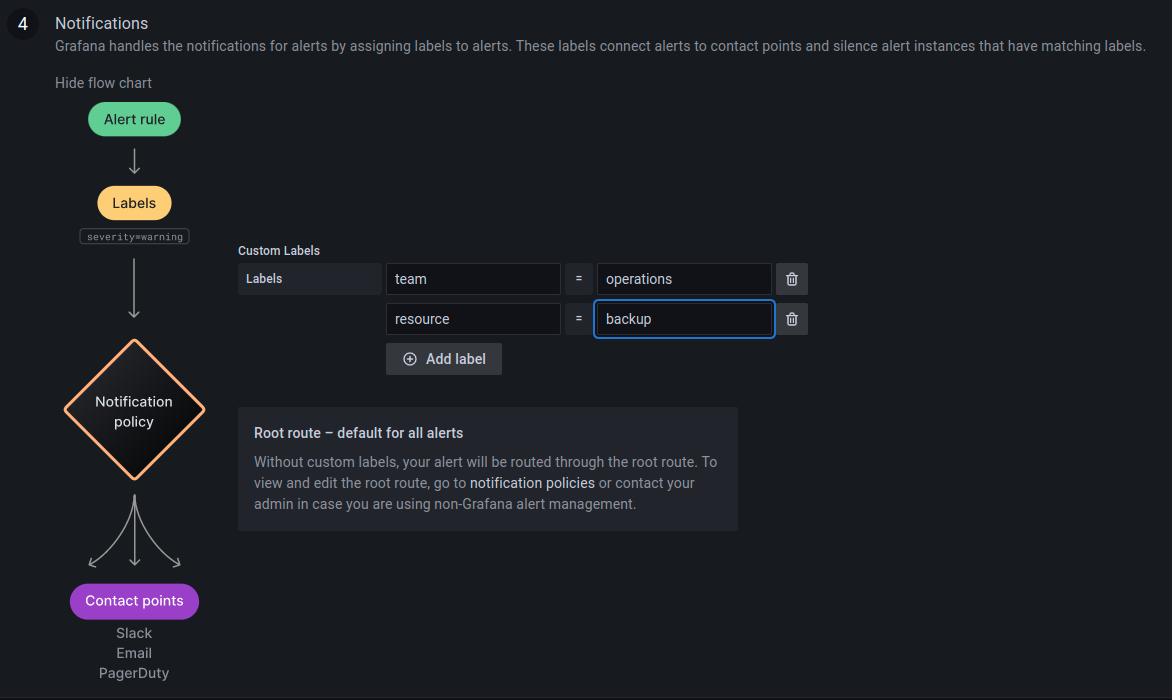
In this example, the labels team:operations and
resource:backup have been used.
Click on Save and Exit to save the dashboard with this alert rule and
exit.
Contact Points
Contact points are used to configure the communication medium for the alerts that are going to be generated. For example, in some scenarios, it might be useful to get a slack message as soon as an alert is fired. In that case, slack must be configured as a contact point. To see a list of all the contact point types, refer to this Grafana documentation.
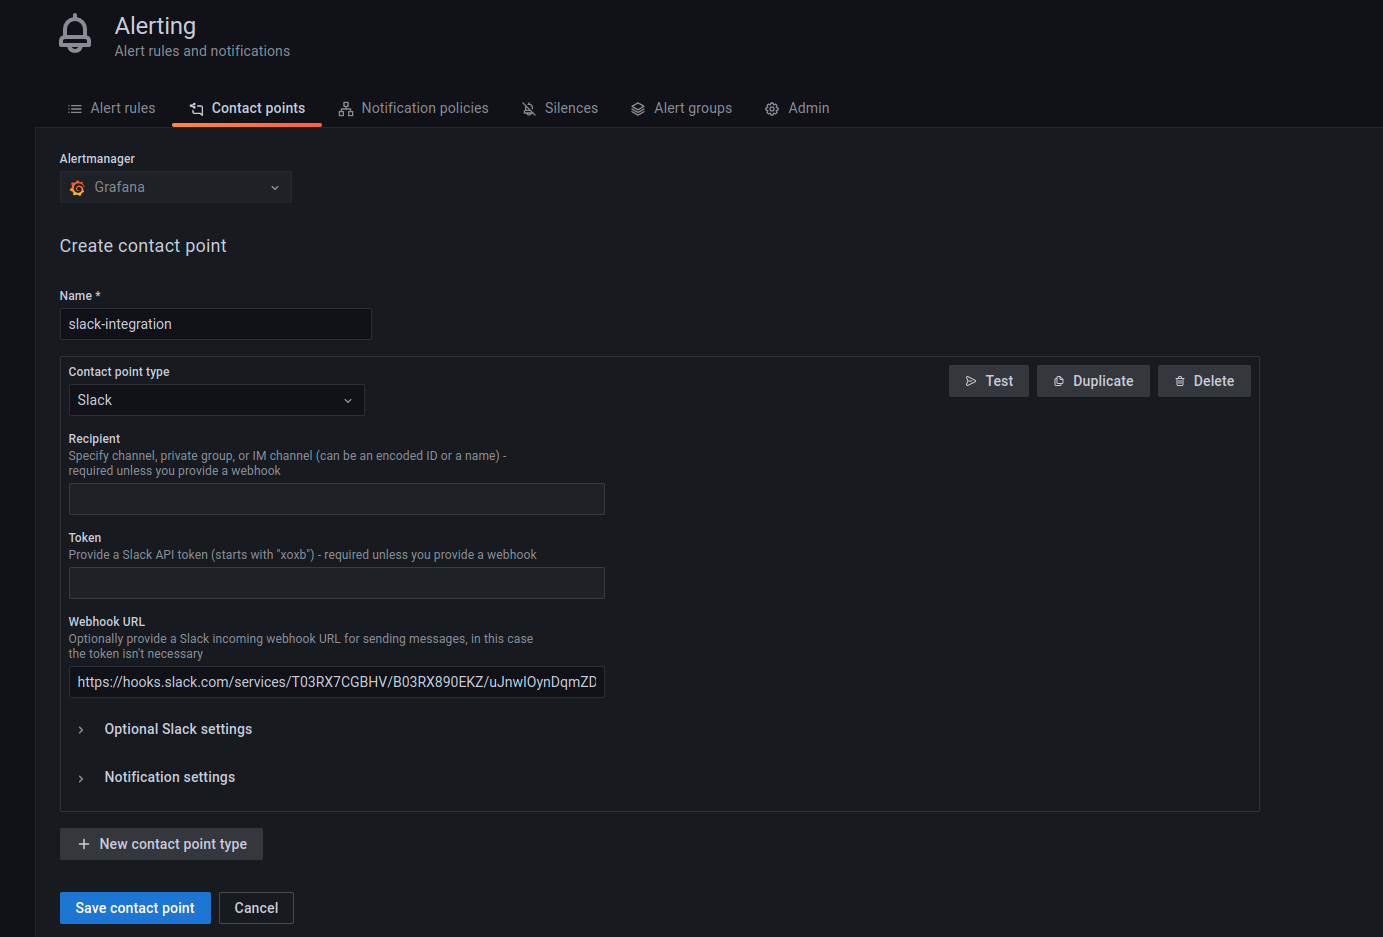
A contact point can be configured by going to the Alerting dashboard and
then clicking on New contact point under the Contact points tab.
In the example below, slack has been chosen as the contact point type.
Notification Policies
Once the alerts rule and contact points have been configured, the relationship between these two configurations is established by creating a Notification policy.
A notification policy can be configured by going to the Alerting
dashboard and then clicking on New specific policy under the
Notification policies tab.
The example below uses the same labels specified while creating the alert rule in the previous step.
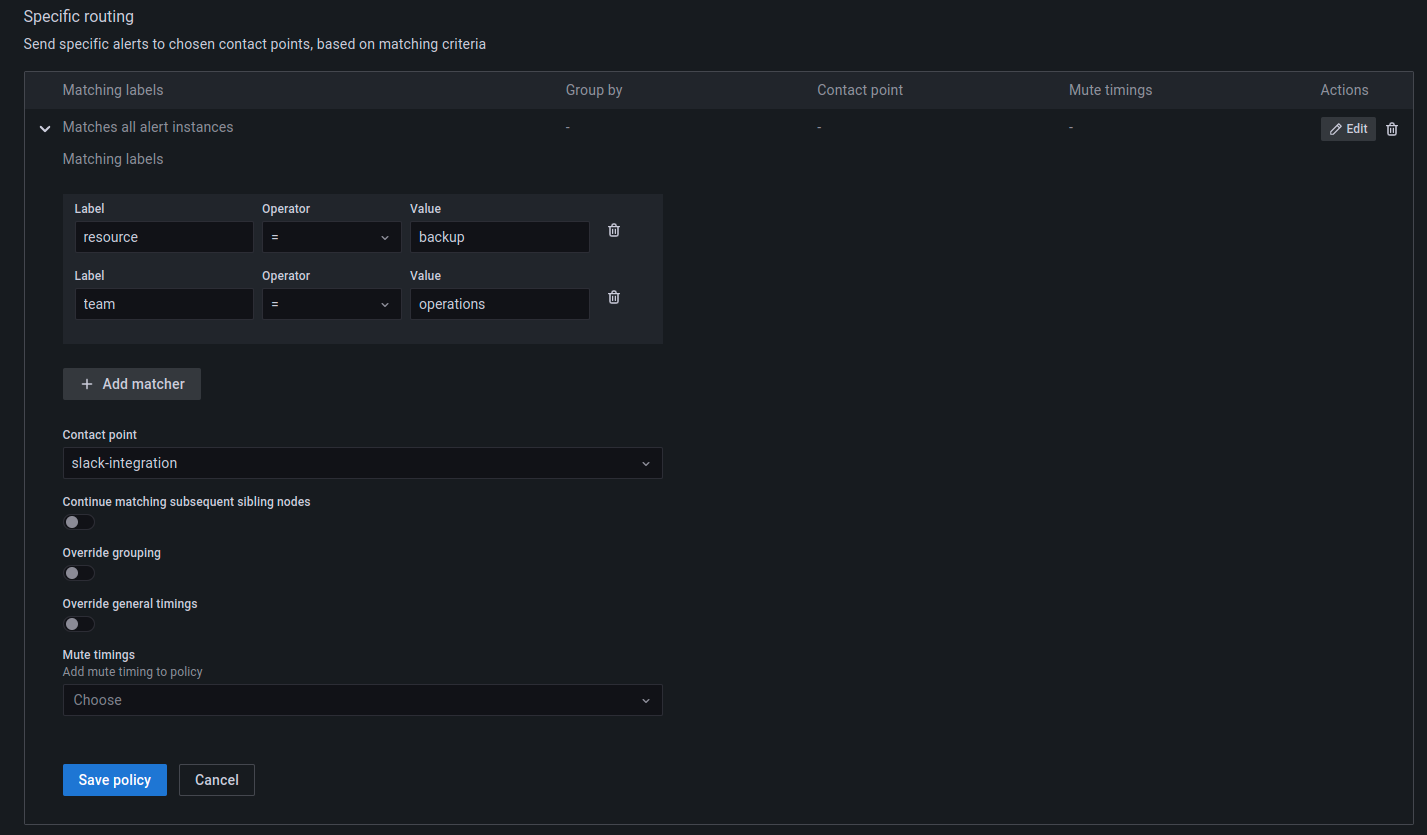
When an alert is generated based on the rule configured, notifications will be sent to the slack channel.
Integrating External Prometheus with K10
To integrate external Prometheus with K10, set the flags
global.prometheus.external.host and global.prometheus.external.port.
If external Prometheus is setup with a base URL, set the
global.prometheus.external.baseURL flag. Make sure RBAC was enabled
while setting up external Prometheus to enable target discovery.
Scrape Config
Update Prometheus scrape config as per instructions given below. (Note. yq utility is needed to execute commands successfully)
# Get prometheus job
$kubectl get cm k10-k10-prometheus-config -n kasten-io -o "jsonpath={.data['prometheus\.yml']}" | yq '.scrape_configs[0]'
job_name: httpServiceDiscovery
http_sd_configs:
    - url: http://metering-svc.kasten-io.svc.cluster.local:8000/v0/listScrapeTargets
# Update prometheus configmap with given output.
The targets will show up after adding the scrape config. Note that the targets will not be scraped until a network policy is added.
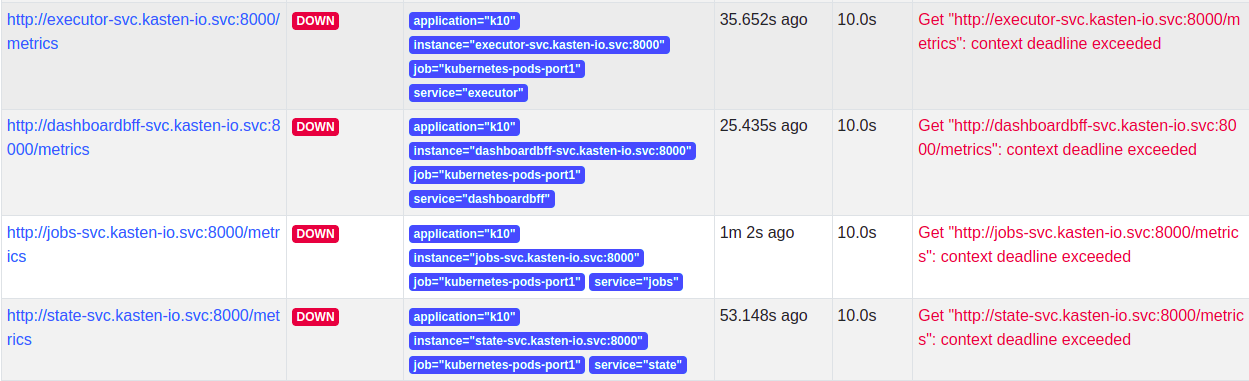
Network Policy
Once the scrape config is in place, the targets will be discovered but Prometheus won't be able to scrape them as K10 has strict network policies for inter-service communication. To enable communication between external Prometheus and K10, a new network policy should be added as follows.
Add a label to the namespace where external Prometheus is installed -
kubectl label namespace/prometheus app=prometheus and apply
the following network policy to enable communication.
apiVersion: networking.k8s.io/v1
kind: NetworkPolicy
metadata:
  labels:
    app: k10
    heritage: Helm
    release: k10
  name: allow-external-prometheus
spec:
  ingress:
    - from:
        - namespaceSelector:
            matchLabels:
              app: prometheus
  podSelector:
    matchLabels:
      release: k10
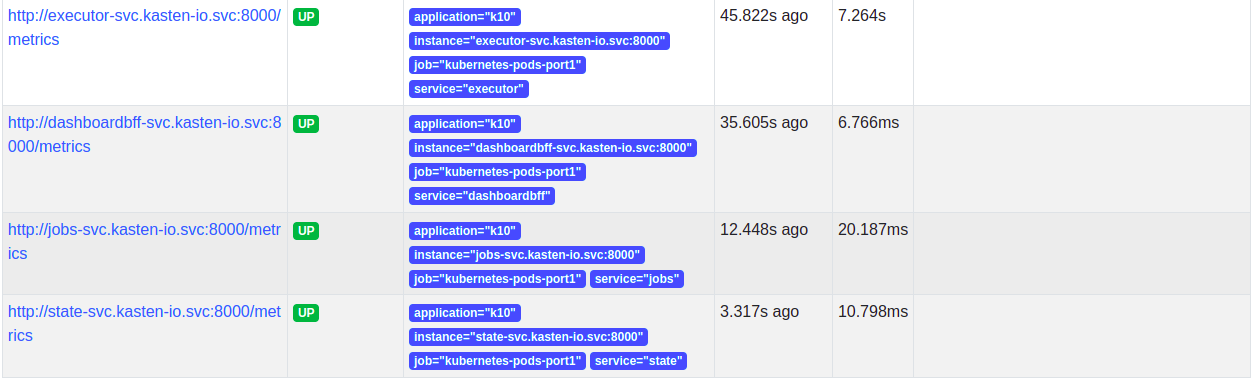
Once the network policy enables communication, all the service targets will start coming up and the metrics will be scraped.
Generating Reports
K10 Reporting provides regular insights into key performance and operational states of the system. It uses prometheus to obtain information about action runs and storage consumption. For more information about K10 Reporting see Reporting